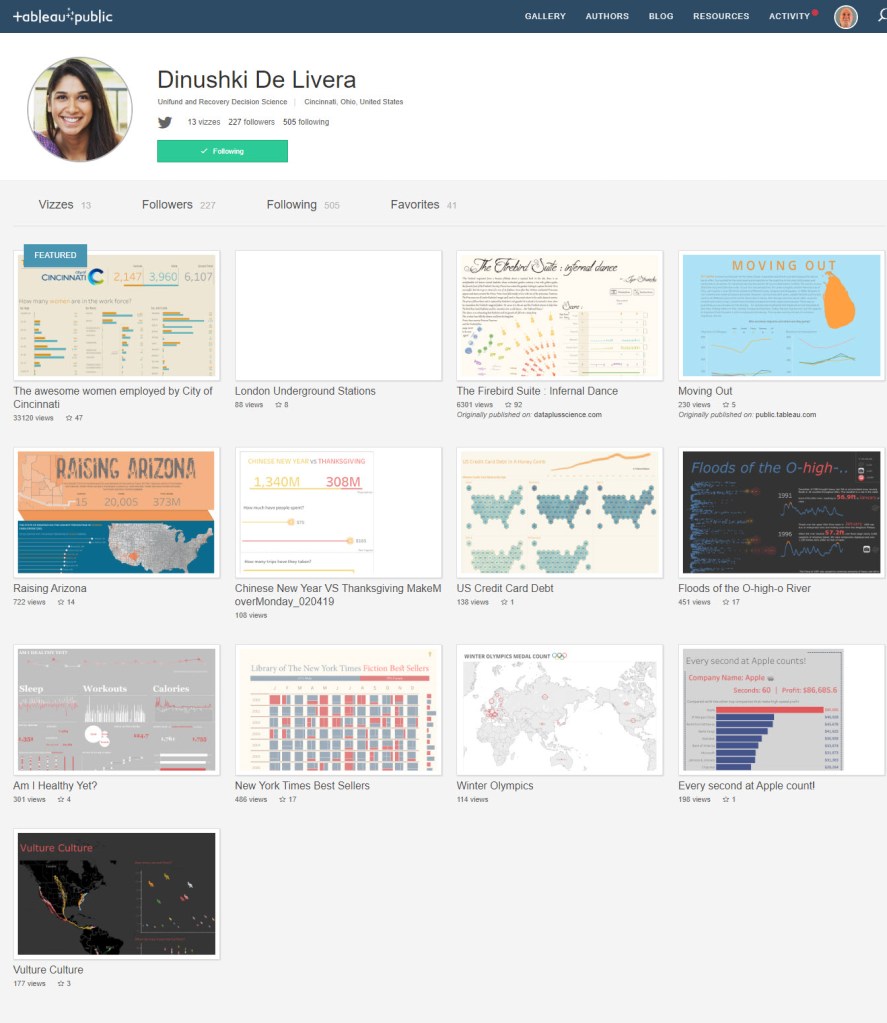
Dinushki De Livera Bio
My name is Dinushki De Livera, I was born and raised in Colombo, Sri Lanka. I moved to the U.S. for college and now reside in Cincinnati, Ohio. I graduated from the University of Cincinnati with my bachelor’s degree in Economics and Finance with my Masters in Applied Economics. Today, I work at Unifund as a business analyst and I am also an adjunct professor at the University of Cincinnati teaching Micro Economics. If you’re eves dropping on me, I’m probably talking about data or food.
QUESTIONS
YouTube Video: https://www.youtube.com/embed/y7JC_UhZUso?autoplay=1&modestbranding=1&controls=1&fs=1&showinfo=0&rel=0&vq=hd1080
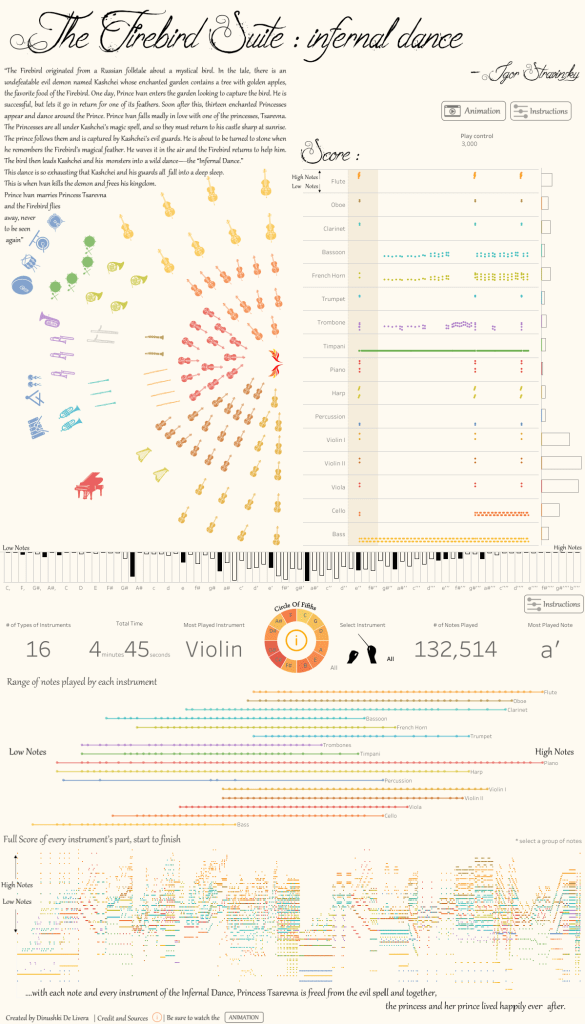
Michael: Hello Dinushki. Congratulations for making the shortlist for the Kantar Information is Beautiful 2019 awards. Your entry, The Firebird Suite: Infernal Dance is really breath-taking, and the video is one of the most amazing visuals I have ever seen. Can you tell my readers your process for developing this dataviz? For example, how did you decide on the topic, find and gather the data, design and then develop the data viz in Tableau?
Dinushki: Thanks for the kind words, Michael, and thanks for taking the time to interview me. The firebird viz was created for the 2019 IronViz Feeder 2. As soon as the topic for this round was announced to be “music”, my co-worker Kevin Flerlage and I started brain storming ideas. We talked about topics we should stay away from and topics that could be interesting, etc. I was trying to think what relationships I had with music. I come from a very musical background, my grandmother, aunt and sister are exceptional musicians, and somehow the gene missed me. Anyway, my aunt is the lead violinist (referred to as “first violinist”) of the Sri Lankan orchestra and she came to my mind. My first question to Kevin, “Has anyone visualized an Orchestra before”? and when I heard no, I locked it down! I thought it would be unique, exciting, challenging and also, if I pulled this off, it would kind of make up for me not being blessed with the music gene. I took this idea to my teacher/boss/mentor Jeff Shaffer and his eyes lit up! I knew I had hit a soft spot since he is also an incredible musician (trumpet), has a degree in music and has played in the Cincinnati orchestra in the past. Right then and there I had the whole team interested! Jeff started pulling up pieces that he thought would be appropriate. If not for him, I would have probably visualized Cannon in D, the Wedding March or Swan Lake. We went through a couple of pieces then listed to the Infernal Dance from the Firebird Suite by Stravinksy, written for a ballet. Yes! This is it! Right from the get go there was a loud, exciting and beautiful cord that got the adrenaline flowing and the whole piece was just magical. Can it get any better? Yes, it even had a Russian folktale to paint a picture in your mind with the beautiful sounds. After reading the whole story and listening to the piece, I couldn’t even imagine what an amazing ballet it would be. Now it was up to to me to bring life to this masterpiece through data, through Tableau.
This is very overdue, but I plan to complete a blog post about the details of this Viz with the nuts and bolts of how I created it.
I will say though, this Viz does not have any crazy complicated features. It definitely has some neat ticks, but the aspects that took the most time were custom creating the orchestra and lining up the music with the Tableau animation play control.
Michael: You are a Business Analyst with the Unifund CCR. Can you tell my readers a little bit about how you use Tableau at work?
Dinushki: Sure, Unifund is a technology company that happens to be working in the financial services industry. I joined Unifund after hearing about an opening from a PhD student (Hamed) at the University of Cincinnati when he was helping with me solve a problem from my econometrics class. I had taken a data visualization course in college that was taught by Jeff Shaffer at the time. So Hamed, said there’s a opening at the company Jeff works at and asked if I was interested in an analyst role which would require me to work with Tableau. “Yes!, I loved that class”. I went in for my interview a little nervous since I was going to be interviewed by my professor. What if he asked me something I learned in class, but I wasn’t paying attention at the time? I studied up some of the content I learned in the class and I was quite ready for some dashboarding questions. I met with Jeff and the first question…..”How many fire stations are there in the US”…… errr…what? He’s joking right? I realized quickly that everyone in the room was waiting for an answer and he wasn’t joking, but I also realized that he wasn’t looking for a number. He was trying to see my thought process…. Instantly I liked him! I started rambling off my thought process. After a couple more critical thinking, equation solving questions I realized I really wanted this job. If my interview is going to be this challenging, then wow am I excited for the day-to-day work! I’ve been here 3 years now, and have loved every minute of it.
Anyway, at Unifund today we are heavy users of Tableau. To be more specific, we have over 280 dashboards on our server and for a company of 110 people, that’s a lot. Each manager has his/her customized dashboard and even some of our operations staff have their very own dashboard that they work with on a daily basis. I work a lot with Kevin Flerlage, under Ethan Hahn and Jeff Shaffer. I consider myself so spoiled and privileged to have such legends to learn from everyday. If you’re reading this, thank you, I appreciate you.
Michael: Can you tell me three of your favorite Tableau Desktop tips and tricks?
Dinushki:
Tip one – If you’re stuck in a table calculation, use INDEX to help you number each step. It helps immensely. Lilach Manheim has a great video explaining this: https://www.youtube.com/watch?v=276FbVhd1FY
Tip two – Did you know that you can drag the blue corner of the canvas on to the sheet and this will all automatically color your graph? I posted this on Twitter a while back: https://twitter.com/deeVizable/status/1199395091862970373
Tip three – If you create a map and you don’t need it to zoom in or out, you can simply take off the map options and your map will stay still and pretty (a lot of people may know this, but a lot of people don’t and are amazed when they find out).
Last one – I just used this today, and it probably saved me about 10 minutes of formatting time. When labeling tall bars/area charts and your labels don’t line up perfectly, adding an invisible reference line to add some padding works like a charm! It’s also great for syncing up the axis on multiple charts. Refer — https://t.co/6SNXIwciqm?amp=1

Michael: As a kid growing up in Detroit, we use to take mini-vacations to places in Ohio like Cedar Point and Cincinnati. It has been decades since I have been to Cincinnati. What places would you recommend people see there today?
Dinushki: I moved to Cincinnati from Sri Lanka 9 years ago. And I have to say, I miss my paradise island, but I also absolutely love it here too. Fun fact about me, I’m a huge foodie and I have probably been to 85% of the restaurants in city of Cincinnati. That’s a big statement since a new restaurant seems to pop up daily. This city is growing at an incredible rate and I’m so proud to be a part of it. I’m so into food and restaurants that I even co-started a foodie Instagram profile called ForkCincinnati and now we’re considered “Food Influencers” – hey, I’ll take it! So apart from checking out the food scene here, I would definitely recommend the Cincinnati Art Museum (also has a wonderful restaurant/café inside), Union terminal, Music Hall and we have some beautiful parks that overlook the whole city. There are some fun and exciting events that happen during the summer such as Octoberfest, Bock Fest and Taste of Cincinnati – again lots of delicious food and drink here. Kings Island is a fun amusement park to check out, lots of fun rides for adults and kids. Also—if you like Tennis, the APT tennis tournament takes place in Cincinnati around August, so you get to watch all the superstars!
Most importantly, if you’re in the Cincinnati area, reach out to me and I will help you plan and navigate your way around the city!
Michael: You have an incredible background in Economics. I took a few Economics classes in college, but now wish I had taken more. Can you tell me why you think Economics is so important for a person majoring in data science or analytics to learn in college today?
Dinushki: I loved economics from the very first economics class I took. I still love it so much that I now teach economics at the University of Cincinnati part-time. I think it’s so important to at least have the fundamental understanding of how the world works in terms of policies that enrich a country, city or your own life. It’s important to understand how a person’s day-to-day activities and tasks are helping the economy as a whole. Economics also gives you an immense understanding and direction to critical thinking. This is a skill that will help you in any job you choose, particularly data science or analytics. I would highly encourage students to take a Micro and Macro-Economics course in college because this is a subject that will actually teach you some things that you can and will apply for the rest of your lives.
Michael: What do you feel is missing from Tableau Desktop? What features would be on your wish list to see added to the application?
Dinushki: It’s great that you have a platform to speak your opinion, raise your concerns and make your suggestions. What’s even greater is that they actually listen. So I must give them credit for that, they’re making an effort to give the users what they want. For example, we have been asking for dynamic parameters and I hear its coming up very soon.
I also think that there some efficiencies that could be improved in terms of formatting and also could we have a point-and-click to make curvy line? That’s all.
Michael: What were your three favorite things you attended or did at #TC19?
Dinushki: My favorite part was definitely meeting the #datafam. It’s amazing how you interact with someone online and have this instant connection when you meet face to face. Everyone was so lovely and personable.
Secondly, most of the sessions I went to were invaluable. They were very informative, educational and equally mind blowing.
Number three was the Tableau Tip Battle that I was a part of. It was very cool to see my fellow Tableau rock stars get a little competitive but in the best way. I learned so many new tips and tricks after that session. And was amazed by some of the other contestants’ ability to work so fast under pressure.
Michael: What is next on your “To Do” list? What can the Tableau community expect to see from you in the near future?
Dinushki: I am currently working on a website that I would like to launch along with my first blog post about my Firebird viz. Life gets in the way sometimes and stuff like this gets pushed back. I build dashboards at work so often that I’m going to start putting some of those looks and techniques out there. I wish to be more active on Tableau Public this year after the launch of my website. Be on the lookout for something from me soon.
Tableau Public Link: https://public.tableau.com/profile/dinushki.de.livera#!/