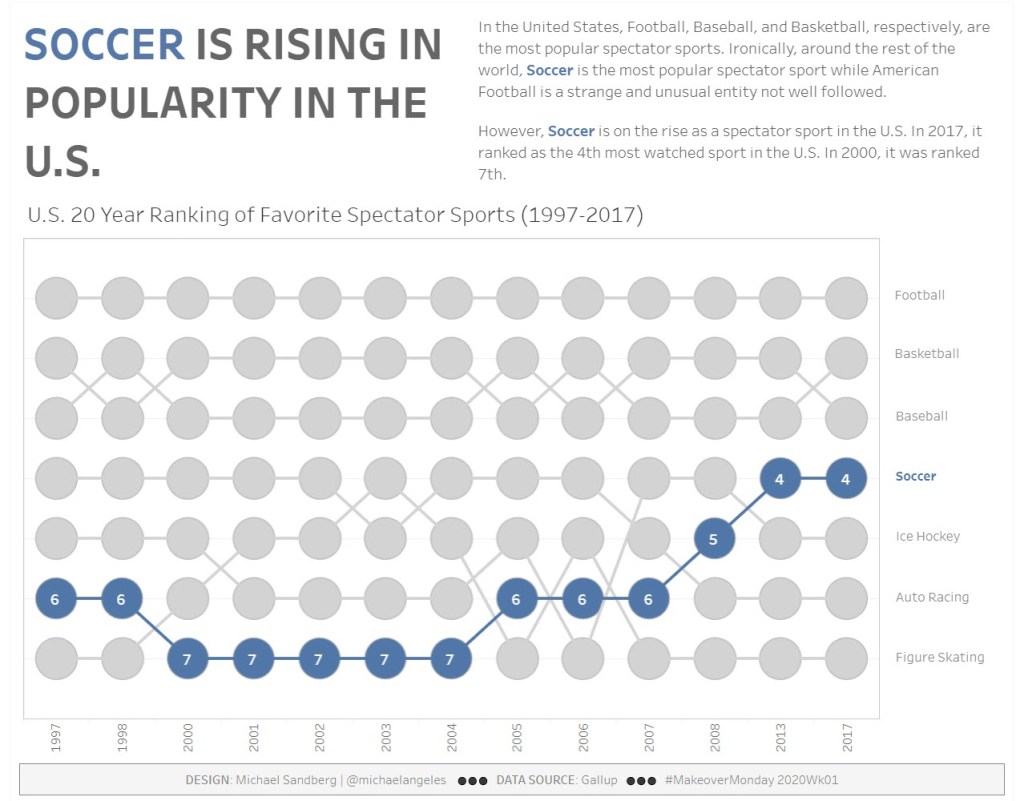
I am getting a late start to #MakeoverMonday for 2020. Here is my #MakeoverMonday for Week 1. Inspiration by Ian Conlon. I used a Bump Chart.
A Bump Chart is a special form of a line plot designed for exploring changes in rank over time. This chart helps compare the position / performance / ranking of multiple observations rather than the actual values itself. [Google]
Here is the link to my dataviz for this week on Tableau Public.