Readers:
This is something I have been meaning to post for a while. I think all of you Minard Map lovers, Data Visualization historians, KANTAR fans, and history buffs will find this really exciting.
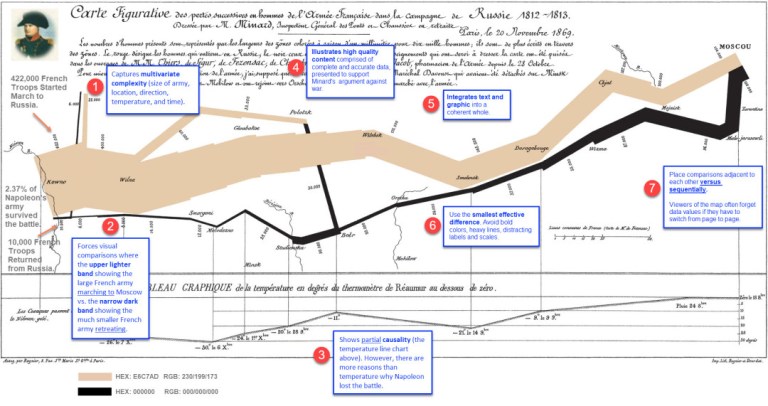
As many of you are aware, in 1869, retired French civil engineer Charles Joseph Minard documented and then summarized eyewitness accounts, and drew his now-famous map, illustrating Napoleon’s 1812 campaign against Russia, which resulted in the defeat of the Grand Army.
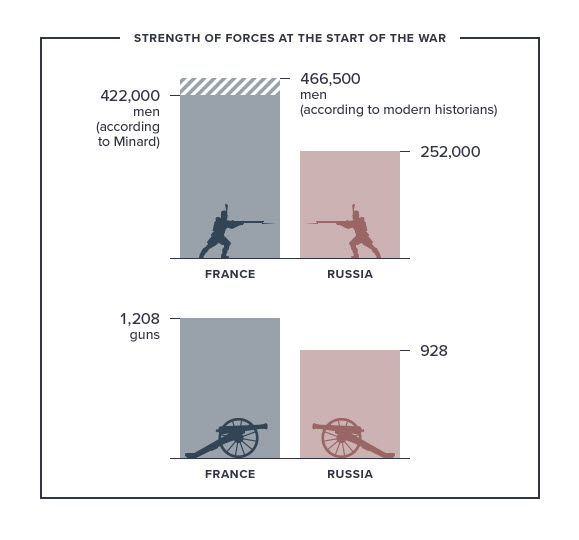
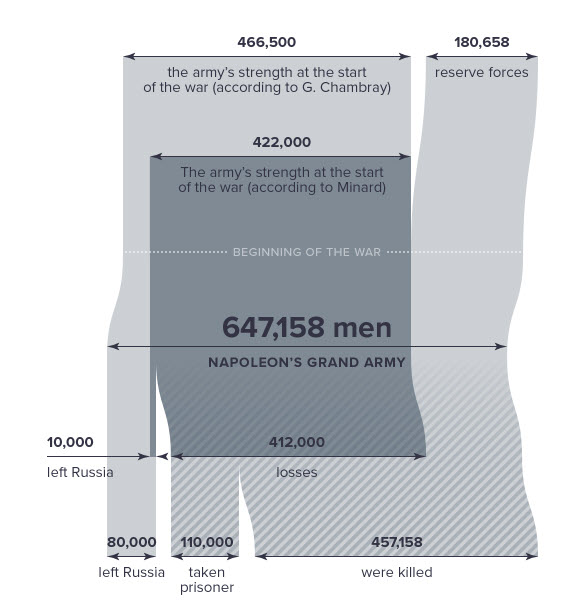
According to Minard’s interpretation of the war, Napoleon’s forces were reduced from 422,000 all the way down to 10,000 (only 2.7% of his army survived).
The Russian News Agency, TASS, has created an interactive story to try and determine if it is really true that Napoleon lost 97.3% of his troops in this 197-day war? And if so, how did it happen and why?
Minard visually shows his answers to these questions in the form of statistics and line width: tactical errors, hasty decisions, exhausting foot marches, fruitless battles and a brutally severe climate. See my annotated version of Minard’s Map below for the visual methods he used.
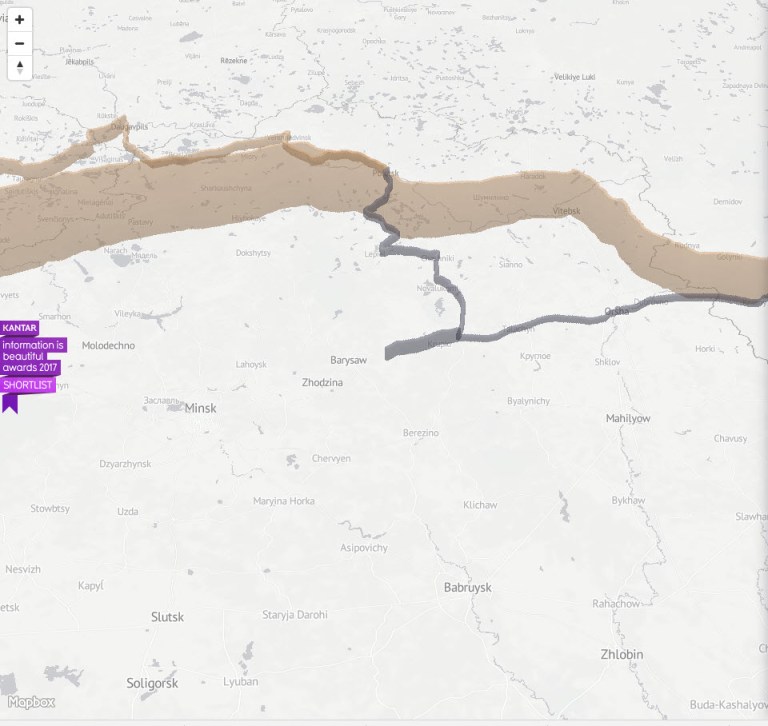
TASS looked into the accuracy of Minard’s statistics and tried to show where exactly the route of the Grand Army lay and to find out what factors resulted in its defeat.
The route of Napoleon’s army is recreated on a modern geographical map. The height columns illustrate the number of troops under Napoleon’s command at different phases of the campaign. The names and boundaries of cities may be different from the historical ones. All dates are according to the Gregorian Calendar (New Style). [1]
Below are some screenshot snippets I made from the story TASS told.
To view the interactive story created by TASS in its entirety, click here.
I hope you enjoy it as much as I do.
Best regards,
Michael
Source:
[1] TASS, 1812 – When Napoleon Ventured East, TASS Russian News Agency, English Version, https://1812.tass.ru/en.