Readers:
 I am continuing my recap blog posts of the Tableau Fringe Festival that occurred earlier this month. Today, I am going to review Mark Jacobson’s (photo, right) presentation, Automating Content Management for Tableau Server.
To view my previous posts on the Tableau Fringe Festival, you can click on one of the links below.
- Part 1 on Reverse Engineering (Kim Unger) can be found here.
- Introducing Emily Kund, Founder of TFF can be found here.
- Part 2 on Social Media Analytics (Christopher Scott) can be found here.
I hope you enjoyed these recap posts. If I left any content out that you want me to include, please let me know.
Thanks and best regards,
Michael
Automating Content Management for Tableau Server – Mark Jacobson
Summary Overview
Mark’s presentation focused on four key topics.
- The content management lifecycle Mark uses in the development of Tableau workbooks and their eventual deployment into Production.
- Content management pain points users may have. In other words, metrics that are hard to track using the Tableau Server built-in monitoring tools.
- What Tableau Server offers today in the way of content management tools.
- A brief overview of his development of Slalom’s Sheriff for Tableau Server tool that helps provide a deeper understanding of how a company’s Tableau workbooks are being used along with other key content management metrics.
Details about the development of Sheriff and its code snippets can be found in three blog posts on Mark’s blog site, vizibly diffrnt, along with other useful information.
I have also provided links to all three parts of Mark’s blog series on this in my Sources section at the end of this post.
Tableau Content Management Lifecycle
Mark started his presentation by giving us an overview of how he uses a content management lifecycle for promoting Tableau content from DEVL/TEST to PROD [2].
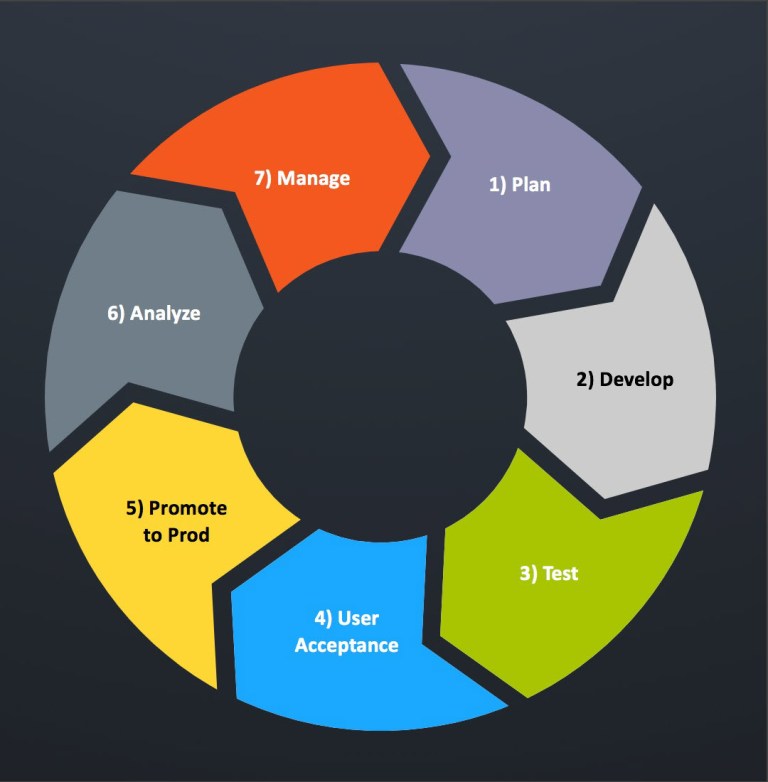
In Mark’s example, it sounded like many of his clients have a DEVL/TEST environment and a PROD environment. Once a workbook has been developed according to the business partner’s requirements, it is pushed to the PROD server for consumption by the business community.
In my world, we have traditionally had three (and four) environments. However, for smaller businesses, this may not be cost-effective for them to maintain three or four physical or virtual servers.
Here are the environments I typically use.
SANDBOX – For testing new versions and updates of the Tableau Desktop and Server software prior to deploying it in DEVL. Because many of my previous applications were used 24/7 and had a service level agreement of 99.99% uptime, we had to ensure we found any vendor issues with the software prior to starting to develop with it.
DEVL – This is where we do actual development of Tableau Workbooks. The business partners typically do not have access to this environment but are often provided demos of the workbooks being worked on to ensure we are meeting the requirement before we move it on for quality assurance. However, highly Tableau skilled business partners can publish their workbooks to this environment where they can be reviewed for performance and completeness issues.
TEST/QA – In the past, we have used these names interchangeably. This is where test plans developed in collaboration with the business partners are tested and bug & enhancement tickets are open. I see the fixing of bugs and the enhancement of features as a very iterative process. Often times, teams will merge these into a followup sprint or a product backlog. I am of the belief that requirements can be “discovered” all the way into the Test phase. There are methodology religious debates about this, but I will save that discussion for another time.
PROD – No changes should directly be made to a production environment. Period. Also, the person who developed the workbooks should not be the same person who migrates them from TEST to PROD. You really need a solid check and balance process here. If not, it could turn into a “the inmates are running the asylum” scenario.
Soapbox
I prefer the term “business partner” rather than “user.” I once had someone say to me, in jest, about a decade or so back, “If you are calling us ‘users’, does that make you a ‘pusher.'” I think referring to the people who consume our applications as business partners sounds more collaborative and inclusive, so I have been using this term for many years.
Content Management Pain Points [1]
Mark then noted several key pain points of content management that occur once an application has been productionalized. A few of the points Mark raised are
- What happens next?
- How do we know if the workbooks we published are being used?
- What if the question our data visualization was built to answer is no longer relevant and our workbooks are not being used by our business partners?
- How do we manage our content at scale?
How Does Tableau Do this Today?
Mark then discussed three ways this can be done with the current release of Tableau Server (Mark’s examples used Tableau Server v10.3) using Content Analytics, Server Monitoring Dashboards, and Data-Driven Alerts.
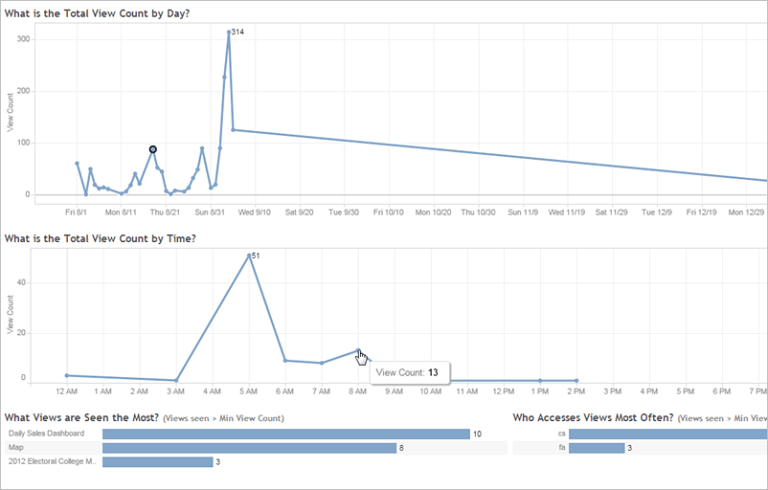
Content Analytics
Content analytics provides information on how often your content is being viewed. From the Tableau Workbook thumbnail view, sparklines show historical data on the popularity of workbooks and views for the past 12 weeks.

Tableau Server Built-In Monitoring Tools
The second way Tableau helps us is via its built-in monitoring tools. We can use the Tableau Server web interface to monitor our server’s health. Some of the things we can do include viewing the status of server processes on each computer where Tableau Server is installed, use administrative views to understand activity on Tableau Server, and determine if the activity comes from users or from server tasks like extracts.
Also, there are many community-built tools you can find by searching the Internet as well as commercial tools like Interworks Power Tools for Tableau.
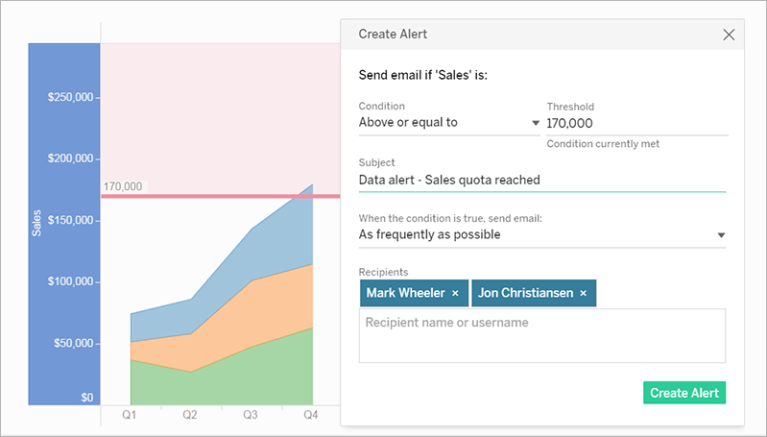
Data-Driven Alerts
The third way Tableau helps us is via data-driven alerts. When data reaches important thresholds for your business, data-driven alerts automatically send email notifications to key people you specify. CAUTION: You can set data-driven alerts on dashboards and views, but not story points.
For time-based charts, use relative date filters so people automatically receive alerts as new data appears. If you don’t own the content, you can ask the author to make this change.
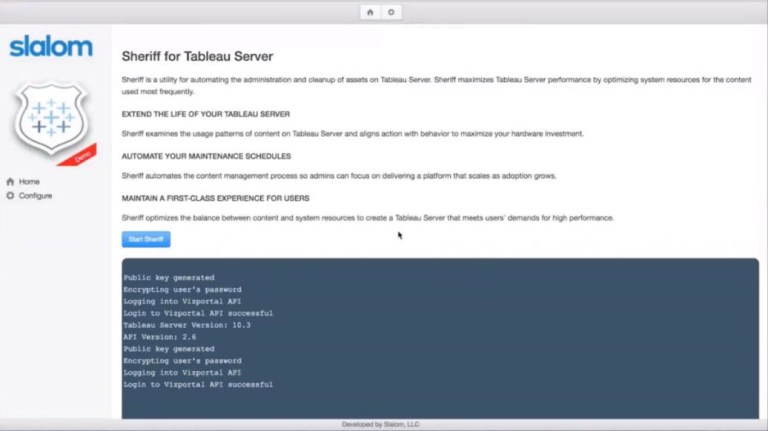
Slalom’s Sheriff for Tableau Server Tool
Mark then gave us a demonstration of a tool he developed at Slalom called Sheriff for Tableau Server. Mark developed this tool to help address the following content management pain points with Tableau Server.
- How do we intelligently detect unused or infrequently used content?
- How do we determine how best to manage non-functional requirements such as scheduling, data governance, retention policies, data latency, etc.?
- Is there a way for us to do all of this automatically?
Below is a screenshot of the main page of Sheriff for Tableau Server. Again, check the Sources links I provide at the bottom of this post to get detailed instructions from Mark on how to build this tool for your own use.
Sources:
[1] Tableau Fringe Festival, Various Presentations and Speakers, December 8, 2017.
[2] Jacobson, Mark, Taking Tableau Further: Create Your own Content Management Tool, Part 1, vizibly diffrnt, June 13, 2017, https://viziblydiffrnt.github.io/blog/2017/06/13/content-management-for-tableau-server.
[3] Jacobson, Mark, Taking Tableau Further: Create Your own Content Management Tool, Part 2, vizibly diffrnt, June 23, 2017,
https://viziblydiffrnt.github.io/blog/2017/06/23/content-management-for-tableau-server-part2.
[4] Jacobson, Mark, Taking Tableau Further: Create Your own Content Management Tool, Part 3, vizibly diffrnt, August 28, 2017,
https://viziblydiffrnt.github.io/blog/2017/08/28/content-management-for-tableau-server-part3.
