
Readers:
 Today, I am featuring an interview with Lilach Manheim.
Lilach is an analyst within the Business Analytics team at Ready Logistics, a transportation logistics company. She holds a Master’s degree in Library and Information Science with a focus on user-centered information design and a Bachelor’s degree in Art History.
Lilach’s work has been featured by Tableau Public, the Viz for Social Good project, and the United Nations Development Group. She is a co-founder of Phoenix, Arizona’s United by Data group, and co-leads the Phoenix Tableau User Group.
I think Lilach offers some great insights on Tableau and data visualization.
Best Regards,
Michael
An Interview With Lilach Manheim
Michael: Hi Lilach, it is very nice to finally meet you. If you don’t mind I am going to dive right into the questions.
A few months back, your Tableau infographic, Fry an egg on a sidewalk (see screenshot below), was named Tableau Public Viz of the Week. Can you tell us a little about your motivation for creating this infographic, what were the challenges in creating it, etc.?
To see Lilach’s infographic in action, click here to interact with it on Tableau Public.
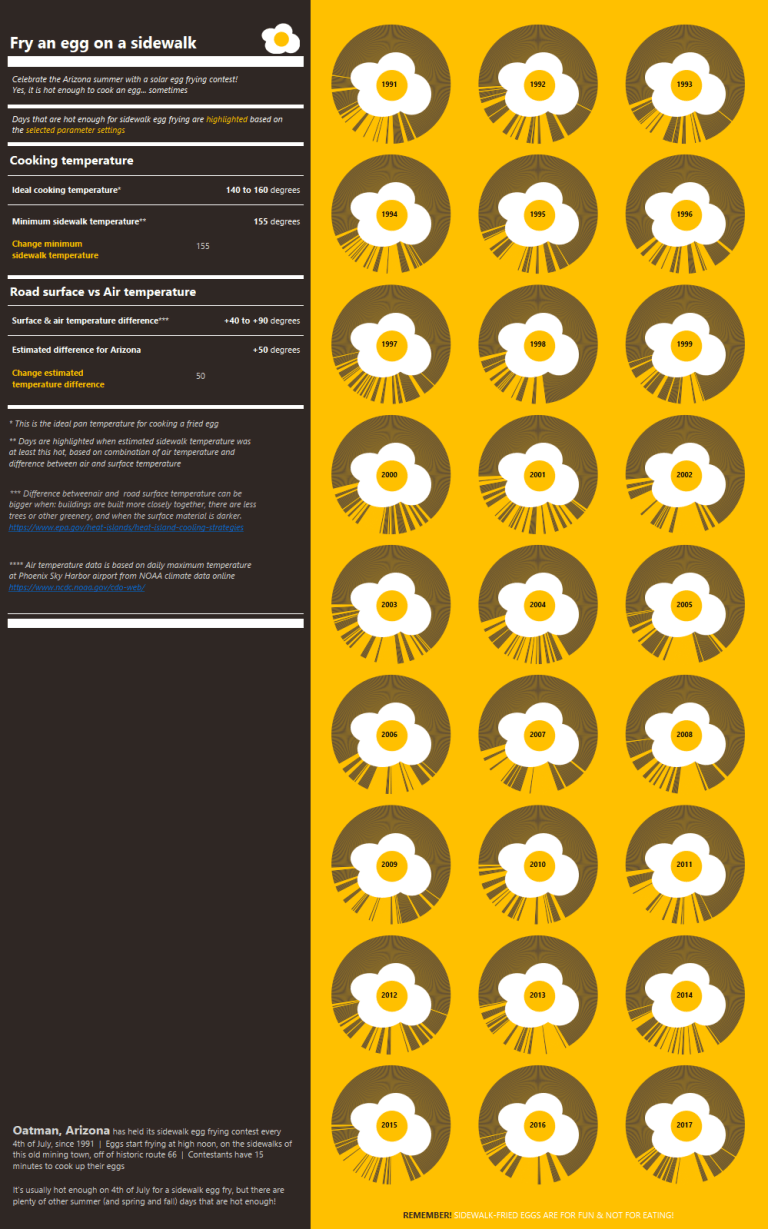
Lilach: I actually created this one for the user group Hometown Throwdown contest that Tableau was running. The biggest challenge, as I find it is with most contests, was finding a data set that related to the topic of the contest. In this case, it had to be something related to my hometown of Phoenix, Arizona.
I decided to do something related to the weather since Arizona is pretty well known for that. But how to make the weather fun? Then I remembered that saying “it’s hot enough to fry an egg on a sidewalk”.
That was really the biggest challenge. Once I got that idea, it was literally all fun and giggles. As a data vizzer who is well aware of the evils of the pie chart, it was especially satisfying to find a non-ironic use case for not only one pie chart, but a small multiple of pie charts!
Michael: I personally find a lot of inspiration on Tableau Public. What are your inspirations when you are looking for ideas for a new data visualization?
Lilach: While I am definitely inspired by the amazing work of the Tableau community, I try to look as much as possible outside of data visualization for inspiration.
For Tableau related work, I subscribe to the viz of the day (although I do wish there was a better way of browsing for new work on Tableau Public). Outside of Tableau, I love to look at the work of Giorgia Lupi and Hanna Fairfield.
But for most of my data visualizations, especially if I want it to be something more on the custom artistic side, I like to look outside of data visualization when I am developing my visual metaphor or overall concept. For this, I like to look at:
- Art (especially modern art and photography)
- Movie posters
- Old advertisements
- Nature (especially for inspiration on color schemes)
- Google image searches for diagrams is amazing!
Michael: Who were your early influencers in data visualization/infographics? How did they inspire you?
Lilach: Early on, I remember one of the first people I noticed on Tableau Public was Russel Spangler. His hot dog contest viz was one of the first I can recall reverse engineering. It was when I first saw someone use a text dashboard object as a horizontal line, and I remember that it really opened my eyes to thinking about dashboard design beyond just charts and filters.
On Tableau Public, I was also inspired by Kelly Martin’s and Anya A’Hearn’s work. I think it was more of a general admiration of their design aesthetic, especially since I felt like it matched my own design philosophy of simple but not simplistic.
Outside of Tableau, I would say my biggest early influence was Stephen Few – but mostly as an anti-example (I know, I know. This is probably heresy!). I just felt like some of the things he talked about as rules, were actually only true in very specific contexts. But mostly, I felt like always optimizing for the data-ink ratio was oversimplifying things. So, he influenced me because he made me realize that experts can be wrong, and I learned to really be critical of whether a best practice is truly best.
Michael: Data Visualization: Art or Science?
Lilach: Both. It takes art to know when and how to apply the science.
Michael: Tableau v10.5 is going to be released soon. Any thoughts on this release?
Lilach: I have been dreaming of the viz in the viz since they first announced it at a Tableau Conference a couple years ago. I’ve gotten to play around with it a bit in the beta release, and it is pretty much everything I was dreaming that it would be.
I am also intrigued by the user annotation feature, but I’m sad that it’s only going to be available on mobile. This is a feature I’ve seen many users ask for in companies I’ve worked for, but most corporate dashboards are accessed via desktop or laptop.
Michael: I know you are involved in the Phoenix Tableau Users Group. Can you tell us a bit about the User Group and what your role is?
Lilach: I’d love to! The Phoenix TUG meets once a month, usually on the 3rd Thursday of the month. We try to have our content vary to meet the interests of our diverse members, from data visualization developers to server admins to everything in between. This includes hands-on how-tos and reviews of Workout Wednesday solutions, as well as presentations from companies in the Phoenix community showcasing how they are using Tableau.
I am a member of the Leadership Council for our user group (see screenshot below), which means that I help plan and develop content, promote community events, and more generally connect members of our local community to the resources and information they need to grow their skills.

Each of the members on our Leadership Council has a particular focus area. I have been a pretty big evangelist for participation on Tableau Public for a while now, but this upcoming year I’m very excited to be working on a couple of projects that will hopefully inspire and support the Phoenix community to show off their skills more on Tableau Public. So stay tuned!
For more information on the Tableau user group – you can follow our official account on Twitter @phxtug, or on LinkedIn at linkedin.phxtug.com.
I also co-lead the Phoenix group United by Data. You can find us on Twitter @UnitedByData.
Michael: What should a young person interested in working in the field of data visualization/infographics study in college? What kinds of new courses and programs could colleges and universities offer to help them achieve their goals?
Lilach: I am definitely a bit biased here, but I believe that understanding the human behavior is key to really standing out in this field (I am biased because this is what I studied in my Master’s degree). But I really do strongly believe that gaining technical proficiency in a tool or a programming language is not the difficult part.
The ability to understand how people interact with information and with the technology that delivers that information, what motivates people to look for information, and what motivates people to remember it and even do something about that information – these topics aren’t often taught as part of an analytics, data science, or even computer science program. And these topics are not always intuitive, or common sense. This is the part of data viz that requires more science than art.
So, I would suggest considering a degree in a psychology field such as HCI, or a degree that includes coursework on those topics, such as Information Science. It might seem counterintuitive to not study something more specific to data viz, especially when those degrees are out there. But as long as you have the portfolio examples to show off your data viz skills, this type of degree will give you an extra skill set that is the missing ingredient for that ever-coveted user adoption.
Michael: What tools do you use for prepping data? What are your pain points with data prep?
Lilach: In my day job, there is a separate team that does data management and creates our data sets, so I don’t do a lot of data prep. I do occasionally write an ad hoc query, either using SQL Server Management Studio or as a custom query directly in Tableau. Of course, there are also the occasional Excel data sources (or maybe more than occasional), especially since the majority of my role is ad hoc analysis.
For my personal work, I use mostly Excel and the tools in the Tableau data pane. The biggest pain point is the need to reshape data. The union feature has helped a lot, but Tableau doesn’t have the juice to do this on larger datasets. This often limits my ability to create more advanced custom charts or at least slows it down a lot.
Michael: I appreciate your insights and look forward to seeing you again at the Tableau Customer Conference 2018 in New Orleans.
