
Readers:
 I am continuing my recap blog posts of the Tableau Fringe Festival. Today, I am going to review Chris Scott’s (photo, right) presentation, Listen: Social Media Analytics.
I hope you are enjoying these recap posts. If I am leaving any content out that you want me to include, please let me know.
Thanks and best regards,
Michael
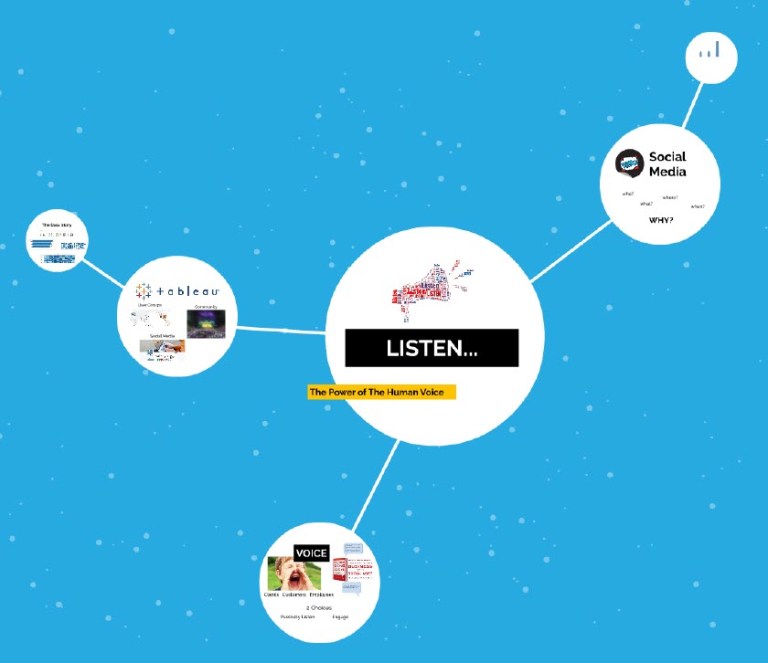
Listen: Social Media Analytics – Chris Scott
Chris started his presentation by providing us Webster’s Dictionary’s definition of the word Listen.
Definition of Listen
1 : To pay attention to sound (e.g., listen to music).
2 : To hear something with thoughtful attention (e.g., give consideration listen to a plea).
3 : To be alert. To catch an expected sound (e.g., listen for his step).
Chris feels this definition ties into the power of the human voice. Everyone has a voice. Also, our ability to listen to the data.

A World Gone Social
Chris then discussed a book he read as part of his research for his presentation. The book, A World Gone Social, By Ted Coine and Mark Babbitt,
Again, everyone has a voice from our clients, customers, employees, etc.
Chris then noted a key quote from the book.
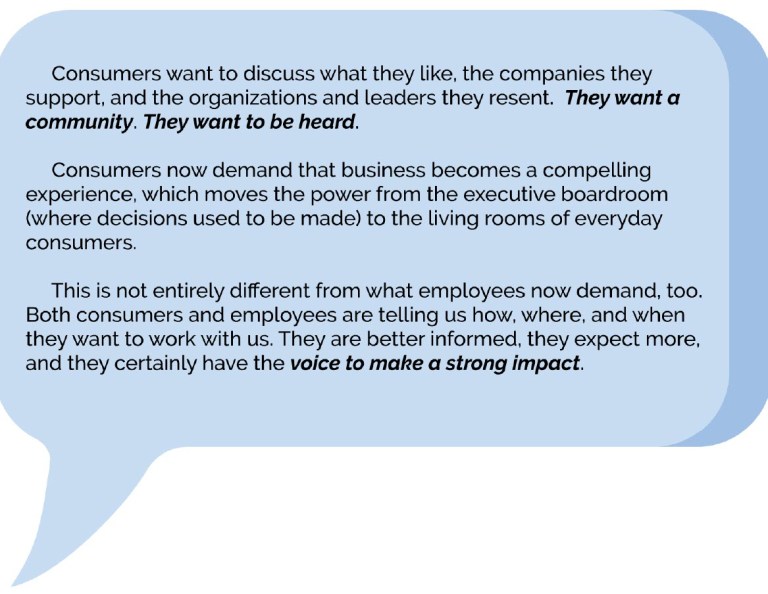
Chris pointed out we have two ways of doing this; by passively listening or being engaged.
We can, by choice, help inform, educate, and teach people about what we do, what we stand for, and how we plan to change their lives.
Unique opportunity to inform educate and teach about what we do, what we stand for, and how we plan to change their lives.

Chris feels there is a company who does this really well: Tableau. They are very good at listening to their customers, listening to their community, and driving the technology they created based on what they have heard from us and their engagement with us.
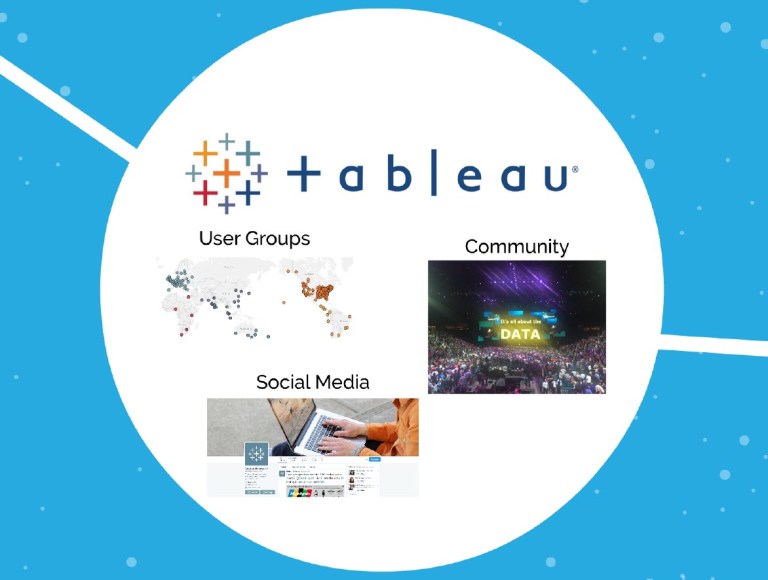
Chris notes that the Tableau Conference, recently held in Las Vegas, was all about the people who attended. It was all driven by the voice of all of us in the Tableau community.
Also, the users groups provide a great forum to listen and be heard.
Tableau is also very active on social media. They not only look and listen to what is said on social media, they also engage.

Data also has a story to tell. It is hard to hear the story from spreadsheets. That is why data visualizations help us listen, engage and understand.
For example, which region was most profitable? Least profitable? Who has the most sales?
The beauty of data visualization helps us tell and listen to the story.

Chris points out that on social media, the voice of the client/customer has the ability to make a strong impact, whether we realize it or not they are extremely powerful, it is up to us whether we harness this power or not.
The story of social media has the similar five questions that are asked in Journalism.
Who – Who is saying? Influencers
What – Content
Where – Where are they saying?
When – Time trends
Why – Ultimate goal…the heart behind the voice, the sentiment
We need to leverage the tools and resources we have to listen to the data using data prep tools and Tableau to gain insights and do some analytical work to get at the all important “Why?”
Chris then discussed the Twitter API and our ability to create and use other social media web data connectors.
In the screenshot below is an example of what Chris referred to as a “stock social media template.” He said these can be found on Twitter, Tableau Public and other places on the Internet. This template shows us the standard questions of who, what, where, when and why.
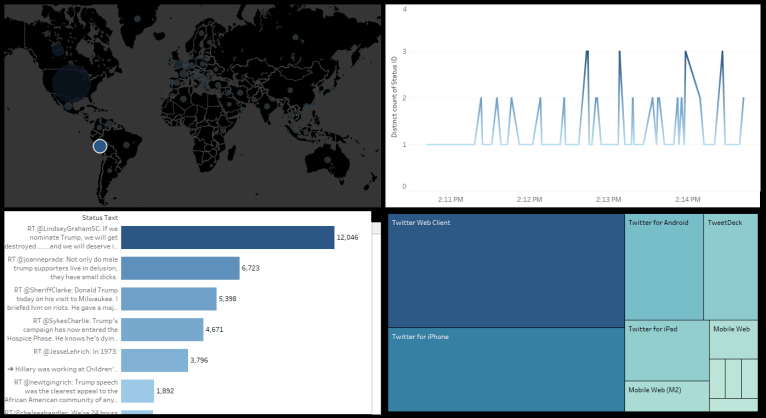
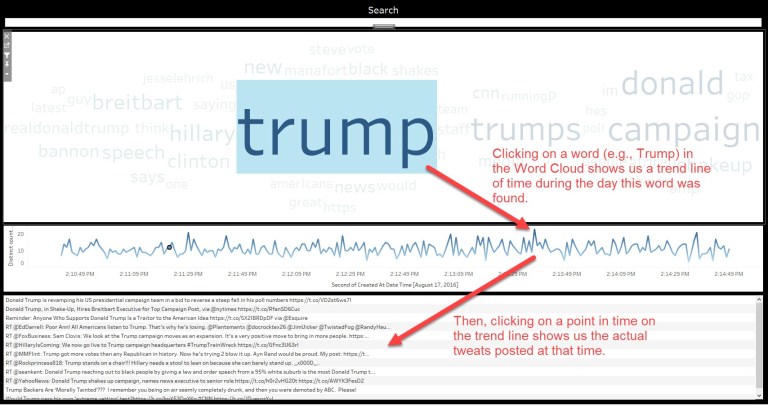
However, Chris wanted to drill-down and use some of Tableau’s out-of-the-box tools to really understand what people were saying on social media. Then, we can review these tweets to understand the sentiment analysis of why people where saying what they were saying at a point in time. This would help us focus our advertising or marketing based on the words people are focusing on and the sentiment associated with those words.
Finally, Chris reminded us to listen to harness the power of the tools we have available.
Next Blog: Automating Content Management for Tableau Server (Mark Jacobson)
Sources:
[1] Tableau Fringe Festival, Various Presentations and Speakers, December 8, 2017.
[2] Scott, Chris, Charlotte TUG Presentation Materials.
