Readers:
I had the good fortune to attend my first Tableau Fringe Festival yesterday. The Tableau Fringe Festival (TFF) is a virtual conference designed to collaborate, mentor and showcase the breadth of knowledge within the Tableau community around the world.
Key Objectives
- Deliver great additional content by those community members who will not be Subject Matter Expert (SME) presenters at upcoming and future Tableau Customer Conferences. Because of the overwhelming interest in presenting, and the limited customer presenter slots available, the goal is to ensure the Tableau community does not miss out on some excellent topics.
- Increase/maintain the visibility of Tableau community members.
- Drive community networking in advance of future Tableau Customer Conferences.
Yesterday’s Agenda
Below is the agenda for yesterday’s TFF.
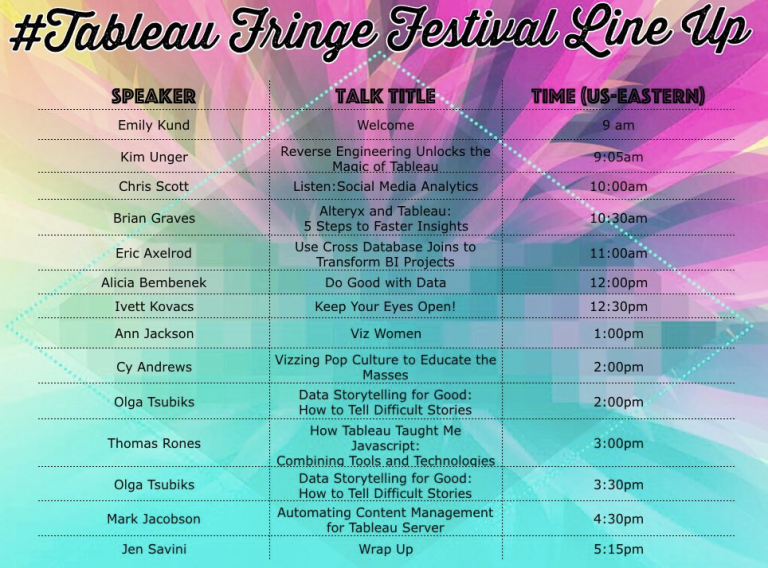
Over the next week, I will be doing focused blog posts on various presentations from TFF. I will focus on items I feel will benefit the Tableau community as a whole, as well as some of the insights and thoughts of these presenters that need to be heard.
I will also include links to resources shared by the presenters.
O.K., here we go!
Reverse Engineering Unlocks the Magic of Tableau – Kim Unger
Kim’s topic is one, I think, is near and dear to most Tableau user’s hearts. We often see great examples of data visualizations (DataViz) on Tableau Public, from webinars, conferences, etc. If we are lucky enough to get a copy of those workbooks, the next step is figuring out how to reverse engineer it.
First, Kim provided us a definition of Reverse Engineering from Wikipedia. [3]
Reverse engineering…is the process of extracting knowledge or design information from anything man-made and reproducing it or reproducing anything based on the extracted information.
Use Cases for Reverse Engineering a Tableau Workbook
Kim discussed some user cases for reverse engineering a Tableau workbook. Probably the most typical use case would be when you have to take over the responsibility for maintaining a workbook that was developed by someone else. You will want to understand the idiosyncrasies of how they organized the data, created custom calculations, special formatting they used, color, etc.
In the same vein, if you have a productionalized workbook that is having issues, you may need to reverse engineer the workbook to troubleshoot these issues.
A lot of us like to use other people’s workbooks as inspiration for a DataViz we want to develop. I know I have searched through Tableau Public for ideas related to topics I need to develop workbooks for and find myself saying, “that workbook is almost exactly what I need. Now, I just need to figure out how they created it.”
Kim discussed a variety of sources we have to find these workbooks. Again, Tableau Public would be a main source of inspiration. So would many of the well-known Tableau blogs, webinars, Makeover Monday examples, etc.
Another reason to reverse engineer a Tableau workbook is to learn new techniques. I have looked at many workbooks and said, “wow! that is really cool!” and then proceeded to reverse engineer the workbook to see how they did it.
Also, reverse engineering workbooks will help you gain a deeper understanding of how Tableau works.
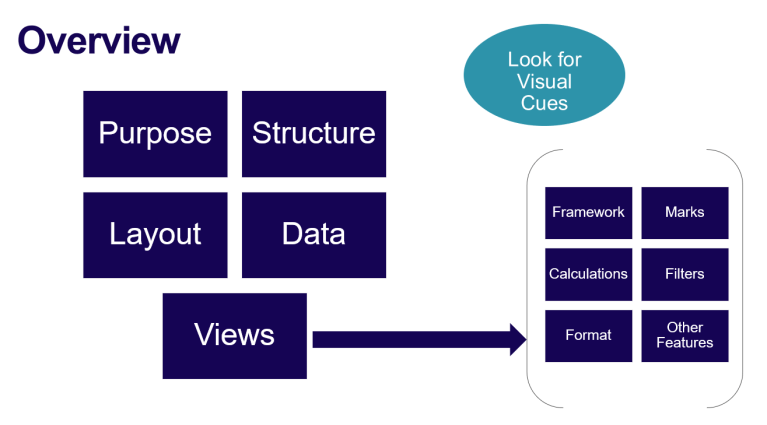
Reverse Engineering Techniques
Kim then went through a series of reverse engineering techniques she developed (see screenshot above).
Kim went through a scenario where she had a client who had some survey data and wanted to display what is important against the level of satisfaction. Also, they wanted to be able to analyze this data by demographic.
She found a dashboard that fit her purpose that was developed by Zen Master, Steve Wexler. She then when through her reverse engineering techniques to better understand how to use Steve’s dashboard to develop her own.
Some of the things she did were:
Determine the purpose of the dashboard.
Was there connectivity between the views?
Who was the audience?
Examine the structure.
How many dashboards are involved?
Are there story points?
Familiarize yourself with the worksheets.
Is anything hidden?
Are the dashboards connected?
Explore the layout.
How many worksheets are there on each dashboard/story?
Are they tiled or floating?
How do the filters affect views?
Are there actions?
Are there device-specific layouts?
Examine the data sources.
What data sources are used?
Are there joins, cross-database joins, unions?
If multiple sources are used, how are they blended?
View the data sources.
What are the Properties?
View the Data
Explore the dimensions and measures
Understand the Views
First, examine the Framework.
Review the Sheet Description using a Ctrl + E
Examine the Dimensions and Measures in view
Examine the Column and Row shelves
What is Discrete? Continuous?
Any fields on a shelf but hidden from the user?
Next, examine the Marks.
What type of chart is being used?
What Mark type(s)?
Are there any shared axis or dual axis?
Examine the Marks Card
Color?
Size?
Labels?
Level of Detail?
Tooltips?
Next, examine the Calculations.
Does the view use calculated fields?
Are there comments in the calculations?
Can you trace calculations to source fields?
Are there table calculations? If so, how are they computed?
Any secondary table calculation?
Next, examine the Filters.
Are there any filters visible to the user?
Are there any filters NOT visible to the user?
Are any filters context filters?
Do the filters apply to more than this worksheet?
Does the filter include or exclude data?
Are the filters based on:
List of values?
Continuous range?
Top N?
Formulas?
Next, Review the Format.
Text
Font
Alignment
Color
Borders
Lines
Axes
Legends
Finally, Review Other Features.
Any reference lines, bands, distributions?
Parameters?
Actions?
Is the data sorted? By what?
Are there Hierarchies? Groups? Sets?
Using the Tableau Community for Inspiration
Kim finished her presentation by discussing places to find inspiration.
The top of the list was Tableau Public. Kim pointed out that there are data visualizations from more than 100,000 authors on Tableau Public. Tableau Public offers you the ability to search by topics or authors. It also provides you the Viz of the Day and the Viz of the Week.
Also, there are community activities such as
Makeover Monday – Weekly social data project. You are provided a link to the chart and data, and then you rework the chart and retell the story or find a new story.
Workout Wednesday – Weekly challenge to test Tableau knowledge. Replicate visualization per requirements.
Viz for Social Good – Harnesses the power of visualization for social change.
Just find one that interests or excites you, and reverse engineer it to learn about the magic behind the curtain.
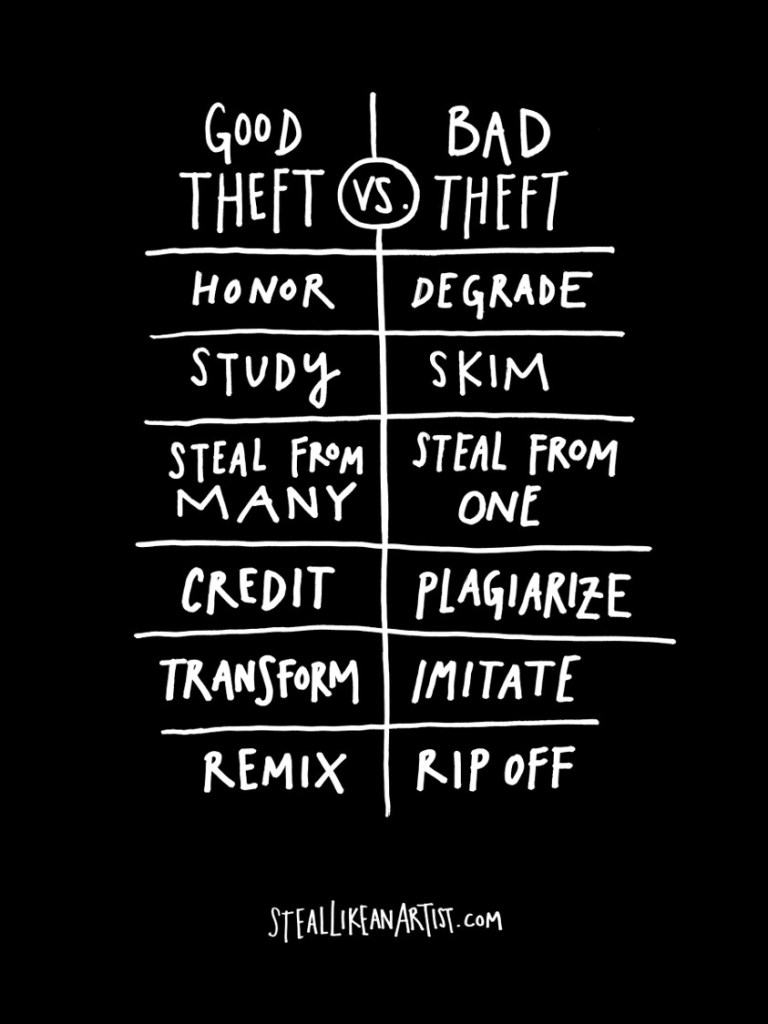
But, don’t forget to give credit where credit is due!
In the beginning, we learn by pretending to be our heroes. We learn by copying. We’re talking about practice here, not plagiarism – plagiarism is trying to pass someone else’s work of as your own. Copying is about reverse engineering. It’s like a mechanic taking apart a car to see how it works.
Austin Kleon – Steal Like an Artist
Next Blog: Introducing Emily Kund, Founder of TFF
Sources:
[1] Tableau Fringe Festival, Various Presentations and Speakers, December 8, 2017.
[2] –, Tableau Fringe Festival, Interworks, October 5, 2015, https://www.interworks.com/resources/events/10/05/2015/tableau-fringe-festival.
[3] Unger, Kim, Using Reverse Engineering to Unlock the Magic of Tableau, DataBrains, December 8, 2017, PowerPoint Presentation, https://www.dropbox.com/s/4qgs62x8sx6csum/Using%20Reverse%20Engineering_TFF2017.pptx?dl=0.
