
Readers:
In Part 2 of my deep dive into Trending in Tableau, I went over how to customize trend lines as well as the Trend Model.
In Part 3, I will finish up this deep dive by discussing how to analyze Trend Models.
I hope you enjoy this series about trending in Tableau.
Best regards,
Michael
Analyzing trend models
 As I mentioned in Parts 1 & 2, much of the context, dataset, and Tableau Workbook, I am using for this blog post comes with the book I mention as the primary source, at the end of this blog post (see book cover, right).
Observing trend lines can be useful, but often we want to understand if the trend model we’ve selected is statistically meaningful. Fortunately, Tableau gives us some visibility into trend models and calculations.
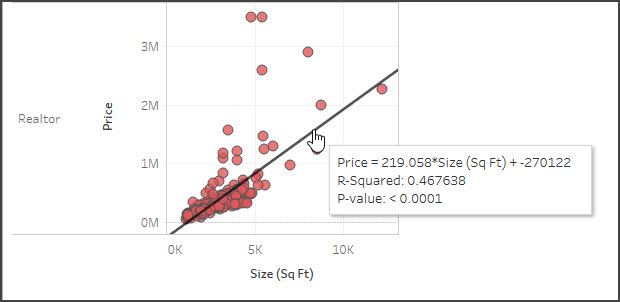
When you hover over a single trend line, Tableau will reveal the formula as well as the R-Squared and P-Value for that trend line.
NOTE
A P-value is a statistical concept that describes the probability that the results of assuming no relationship between values (random chance) are at least as close as results predicted by the trend model. A P-value of 5% (.05) would indicate a 5% chance of random chance describing the relationship between values at least as well as the trend model. This is why a P-value of 5% or less is considered to indicate a significant trend model. If your P-value is higher than 5% then you should not consider that trend to significantly describe any correlation.
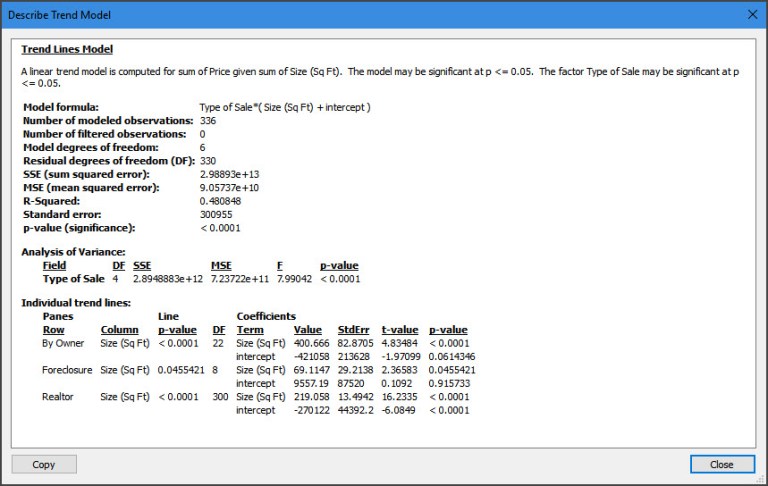
Additionally, you can see a much more detailed description of the trend model by navigating to Analysis | TrendLines | Describe Trend Model… from the menu or by using the similar menu from a right-click on the view’s pane. When you view the trend model, you will see the Describe Trend Model window (see screenshot below).
TIP
You can also get a trend model description in the worksheet description, which is available from the Worksheet menu, or by pressing Ctrl + e . The worksheet description includes quite a bit of other useful summary information about the current view.
The wealth of statistical information shown in the window includes a description of the trend model, the formula, number of observations, and P-value for the model as a whole as well as for each trend line. Notice that, in the window shown above, the Type field was included as a factor defining three trend lines. At times, you may observe that the model as a whole is statistically significant even though one or more trend lines may not be.NOTE
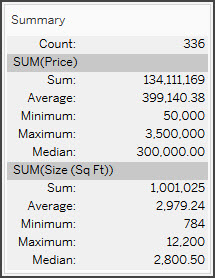
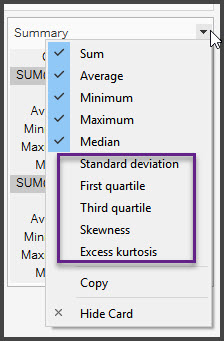
Additional summary statistical information can be displayed in Tableau Desktop for a given view by showing the Summary. From the menu, select Worksheet | Show Summary. The information displayed in the summary can be expanded using the drop-down menu on the Summary card.
Exporting Trend Model Data
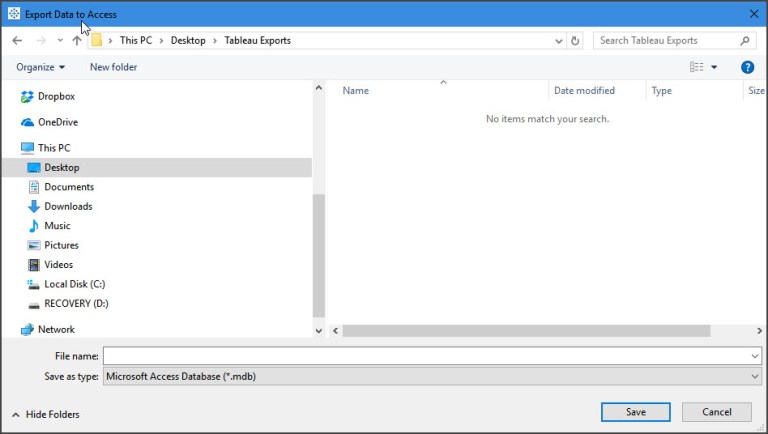
Tableau also gives you the ability to export data, including data related to trend models. This allows you to more deeply, and even visually, analyze the trend model itself. Let’s analyze the 3rd degree polynomial trend line of the real estate price and size scatter plot without any factors. To export data related to the current view, use the menu and select Worksheet | Export | Data. The data will be exported as a Microsoft Access Database (.mdb) and you will be prompted where to save the file.
NOTE
The ability to export data to Access is limited to a PC only. If you are using a Mac, you won’t have the option. In this case, you may wish to read through this section for informational purpose.
On the Export Data to Access screen, specify an Access table name and select whether you wish to export data from the entire view or the current selection (see second screenshot below). You may also specify that Tableau should connect to the data. This will generate the data source and make it available with the specified name in the current workbook.
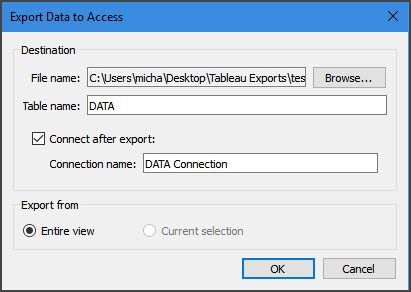
The new data source connection will contain all the fields that were in the original view as well as additional fields related to the trend model. This allows us to build a view such as the following using the residuals and predictions.
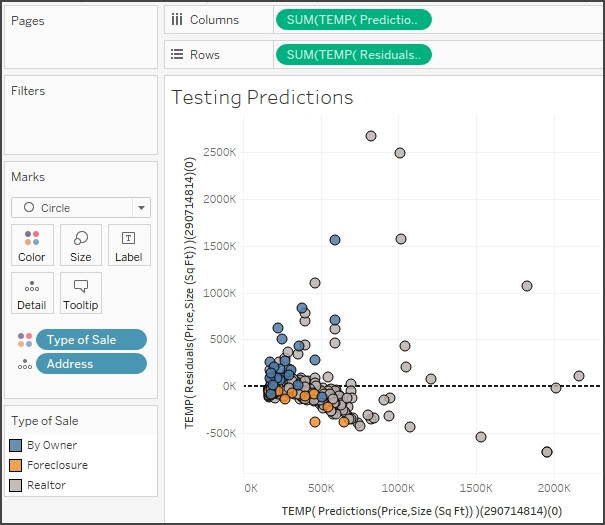
A scatter plot of predictions (X axis) and residuals (Y axis) allows you to visually see how far each mark was from the location predicted by the trend line. It also allows you to see if residuals are distributed evenly on either side of zero. An uneven distribution would likely indicate problems with the trend model.
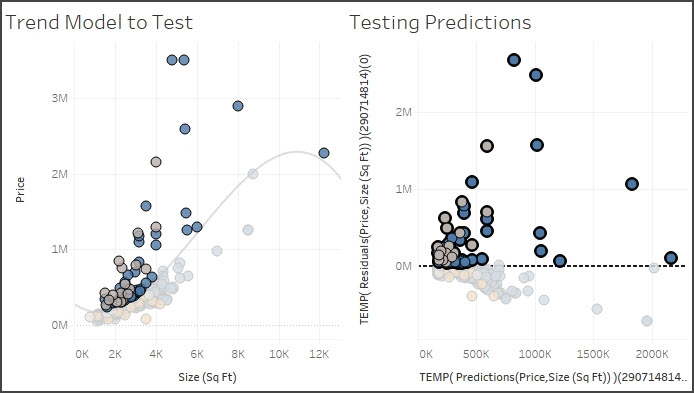
You can include this new view along with the original in a dashboard to explore the trend model visually. Use the highlight button on the toolbar to highlight by the Address field:
With the highlight action defined, selecting marks in one view will allow you to see them in the other. You could extend this technique to export multiple trend models and dashboards to evaluate several trend models at the same time.
NOTE
You can achieve even more sophisticated statistical analysis by leveraging Tableau’s ability to integrate with R. R is an open source statistical analysis platform and programming language with which you can define advanced statistical models. R functions can be called from Tableau using special table calculations (all of which start with SCRIPT_). These functions allow you to pass expressions and values to a running R server, which will evaluate the expressions using built-in libraries or custom-written R scripts and return results to Tableau. You can learn more about Tableau and R integration from this whitepaper (you will need to register a free account first): http://www.tableau.com/learn/whitepapers/using-r-and-tableau.
Source:
[1] I relied heavily on the fantastic Tableau book written by Joshua Milligan titled Learning Tableau 10, Second Edition (see cover image below). I will be blogging a review of this book in the next few weeks. Click here to purchase you own copy of this book.

Michael – thanks for posting. Great stuff.