
Source: Katie Jones, The COVID-19 Impact on App Popularity, Visual Capitalist, May 4, 2020, https://www.visualcapitalist.com/covid-19-impact-on-app-popularity/.
Per Katie Jones in Visual Capitalist,
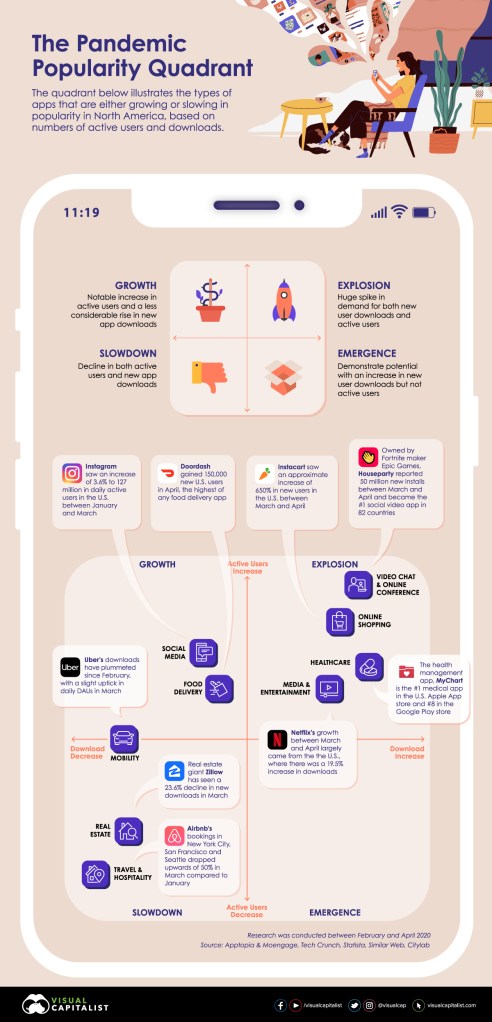
The COVID-19 Impact on App Popularity
Pandemic-induced social isolation has altered the relationship consumers have with technology.
With the physical world now slowly receding, consumers are suddenly more reliant on apps for communication, shopping, staying healthy, and entertainment.
Today’s graphic pulls data from a new report by MoEngage and Apptopia, and it plots the winners and losers of the pandemic from the app world in North America.
Embracing the App Economy with Open Arms
Consumers are looking for different ways to manage their lives while in lockdown, and in some cases, apps could provide the perfect solution.
In fact, people spent 20% more time using apps in the first quarter of 2020 compared to 2019. During that time, consumers also spent over $23 billion in app stores—the largest spend per quarter recorded to date.
While consumers across the globe lean on apps to support them in times of crisis, what exactly are consumers in North America using?

Reblogged this on The Strategic Sync by Fahim Moledina and commented:
The effect on technology and how end-users are interacting has fundamentally changed with COVID-19. Will there be long term effects on companies and their applications. This is a great visual currently on how applications demand is changing as end-users are adapting. It would be great to see some applications come into the emergence category to understand how we are affected. In Alberta the government has released an application that uses Bluetooth to track if you may have come into contact with somebody with COVID but it seems like both people need the application (ABTraceTogether) and there are some privacy concerns for some people.
Either way I am finding people are tuning out the normal graphs as there is data overload and I personally love data and visualizations but with so much data swirling and different views I have started to look to more information and narrative.
I hope everybody is staying safe.
Regards,
Fahim Moledina,
https://fahimmoledina.ca/
http://optisyn.net/
This is a very well-presented visualisation showing how the COVID-19 pandemic has impacted different industries.
The “explosive” growth in industries like healthcare, videoconferencing and online shopping have disrupted these sectors through generating growth rates and challenging capacity, forcing organisations to find new ways to meet dramatically increased demand.
Conversely, the “slowdown” in industries like real estate, travel and hospitality have caused demand for services provided by organisations in these sectors to almost evaporate overnight. This has had immense impacts on workforce, business as usual practices and financial viability.
It will be interesting to see how organisations in the “growth” quadrant can increase their downloads and attempt to further take advantage of this disruption.
Thank you for presenting this data in such a simple, powerful and effective manner.