
Eugenia Kis Bio
As a little girl, I used to play basketball. I loved the amount of action going on throughout the game. Putting 100% into every practice I soon became the captain of the team. The experience shaped my need for social interaction and triggered my passion for creating strong relationships.
I had a dream of playing in the Russian national team, but instead, my quest for new challenges brought me to the Czech Republic where I earned my master’s degree in statistics.
To be able to pay for my studies I started to work as a receptionist in a small boutique hotel in Prague. With every success, I gained more responsibility and freedom. I loved it and before I really realized it, I grew into a general manager responsible for a team of 15 people. Managing a hotel and studying statistics at the same time was not easy but I enjoyed the variety and thrill of everyday life. Looking back I am proud how together with my team we turned a sinking ship into a sustainable business and ultimately won the Tripadvisor’s price of “Top 25 hotels from the Czech Republic”.
My next challenge brought me to the Netherlands where I played a key role in the business development of 2 medium-sized hotels (200 rooms in total). Together with my business partner we started from scratch and went through team hiring, brand building, marketing and revenue management all the way to the set-up of daily operations. Through successful negotiation and partnership building with online travel agencies we managed to keep costs low and revenues high.
After spending nearly a decade in the hospitality industry I was eager to explore new areas. Nowadays, I am an Analytics Consultant and Tableau Certified trainer at Interworks and co-leader of The Netherlands Tableau User Group (NLTUG). I like to enable people through powerful visualizations, help them to gain insight into their business and make data-driven decisions. I’m a Tableau enthusiast and I really like Tableau community where people share their knowledge, support each other and encourage through different projects.
QUESTIONS
NLTUG Link: https://usergroups.tableau.com/Netherlands
Michael: Hello, Eugenia. You are co-leader of the Netherlands Tableau User Group (#NLTUG). Can you tell my readers a bit about the NLTUG and the kinds of activities you have?
Eugenia:
Normally, our Tableau User Group organizes quarterly events. We do so in different cities in the Netherlands to make the events more accessible to a wider audience. This user group is for general public and has different topics and presenters. We mostly have 60-100 people per event. In addition, we organize Enterprise editions where we have a smaller audience of around 30 people. These events have more interactive format which involves more discussions and are tailored to a specific topic to target a certain audience. Because of the COVID-19 we are temporarily running online events. Next Enterprise edition is on the 30th of April. The nice thing about online events is that the capacity is not limited and that everyone can join from around the globe!
We also organize more fun events like Tableau Conference Viewing Party, where we are watching Devs on Stage and enjoy networking.
Tableau User Group is a great option to stay in touch with the community. We love Tableau Conferences, but unfortunately, they are only twice a year (one in the US and one in Europe). Organizing User Groups is like bringing a mini Tableau conferences to the Netherlands.
We always look for new topics and presenters. In case your readers have interesting story to share they can reach out to us via the Tableau community page or Twitter.

Michael: You are an Analytics Consultant at InterWorks EU. Can you discuss how you use Tableau in your current role and a little bit about InterWorks EU?
Eugenia:
Since I’ve joined InterWorks, I have never suffered from boredom. If I should choose one word that describes my work the best, it would be excitement. Passion, natural curiosity and eagerness to create the best available solution is evident in everything we do.
Our clients truly are what makes our work the best. I get to meet so many smart and interesting people, and I get to do something I love. It doesn’t matter if it’s a short Assist call where I’m answering ad hoc questions, a training session where I’m showing tips and tricks or a long-term engagement where I’m helping to build an internal Tableau community—every single day is exciting.
As a global company, communication and efficiency are of paramount importance. We rely daily upon applications like Slack to stay connected. Working in different time zones isn’t an issue as there is almost always somebody online who’s ready to help you with your questions. Plus, chances are high that someone else has already solved it, and by posting the question, other colleagues can learn as well. On the flip side, it is always rewarding when you can help a coworker. Solving puzzles is more fun when done together!
My favorite things are our regular team meetings and yearly company Summit. These are great moments to reflect on the previous months, brainstorm together on ideas and projects and spend time with fellow InterWorkers. These events are a great mix of work and fun. During work-related sessions, we do presentations, discussions, hackathons or learn new tools and features together. For non-working fun, we do things like climbing, bicycle tours, scavenger hunts, escaping crystal mazes and carting races.
Michael: Can you tell me your three favorite Tableau tips and tricks?
Eugenia:
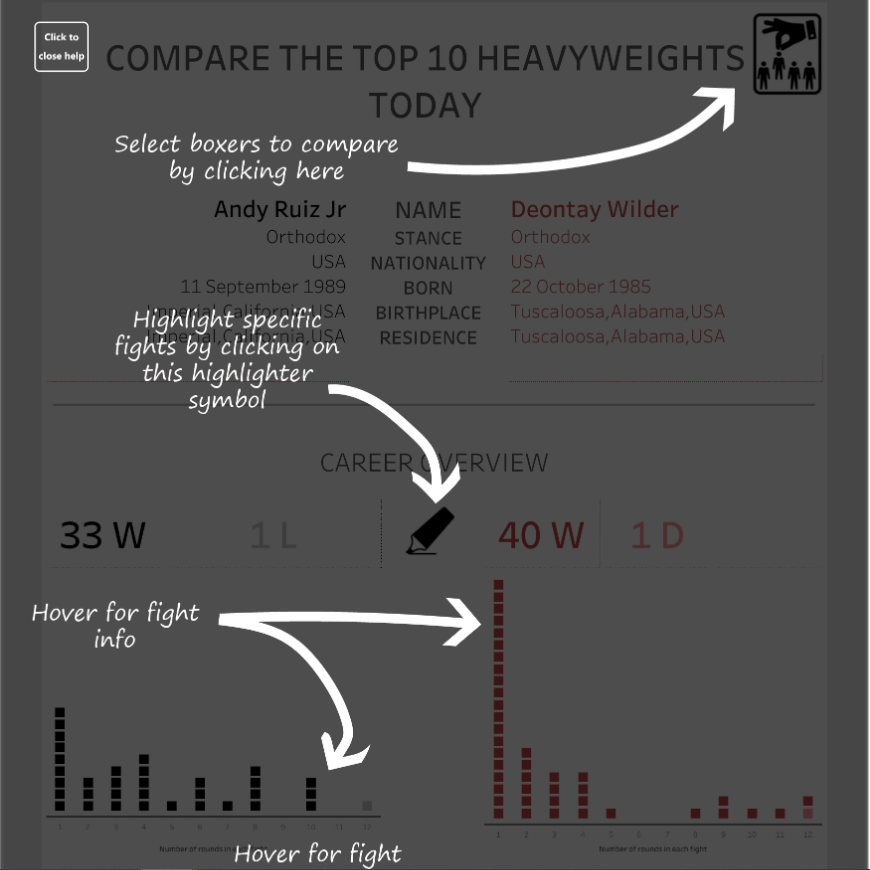
I like shortcuts to faster navigate in Tableau. Therefore, I often use Ctrl+F for search in Data Pane, Ctrl+W for swapping columns and rows, etc. During trainings we often try to go beyond training material and show some useful functions or visual best practices. Personally, I really like to do reverse engineering of the visualizations that I liked or found interesting on Tableau Public. Recently, I found this visualization by Joe Carr. It has an interesting way of giving directions of how to use the dashboard.
In dashboards I appreciate simplicity and functionality. I like when you know from the first glimpse what insights the dashboard is showing and how they can help you in your decision making process.
For the tips and tricks Tableau community offers endless number of blogs and websites: starting from Tableau help, like this one about optimizing workbook performance, through companies’ blogs full of tips and tricks and useful vizzies, like InterWorks or Information Lab and of course individual websites like yours or like website by Andy Kriebel.

Michael: I have never been to Amsterdam. Can you tell me what I would want to see if I were to visit?
Eugenia:
Amsterdam has so much to offer in any season. When you travel to Holland for the first time, I definitely recommend to do standard tourist things like visiting museums (find your favorite on this website), taking a boat trip and renting a bicycle to experience city from a more local perspective. Also, just walking in Amsterdam in different quarters, along the canals or in the parks is a great experience. Throughout the year there are many events that can be interesting to see.
- King’s Day on the 27th of April when everyone is dressed in orange and it’s one big open air party (a sneak peek here).
- Amsterdam Pride which always ends with canal pride in the first week of August. Here is the video from 2019.
- Sail Amsterdam – international maritime event which happens every five years.
- Light festival which features interesting installations along the canals from December to early January. The light installations can be admired in a few different ways: cycle, walk or from the boat.
There are also many places to visit within 1 hour train ride from Amsterdam:
- Zaandam + Zaanse Schans historical city with windmills and interesting buildings (12-18 minutes by train from Amsterdam Central Station).
- Keukenhof is a beautiful tulip park open from mid-March till early May.
- I really recommend visiting other historical cities: Haarlem, Leiden, The Hague, Delft, Rotterdam, Utrecht, Volendam, Alkmaar…
Michael: You are a Certified Tableau Desktop Professional. Can you tell my readers some tips & tricks to prepare for the exam for this?
Eugenia:
I think taking Certified Professional Exam is a good way to check and prove your level of Tableau knowledge. First thing to do is to go through the preparation guide available on the Tableau website and try the sample exam, which will give you a good benchmark of where you stand. Good time management will be essential during the exam. You will not only need to be familiar with the required concepts but also quickly apply them.
I wrote a blog about my preparation and here is Sarah’s Bartlett blog about her experience. There is a pre-requisite of passing Tableau Certified Associate exam. I wrote a blog about that one as well.
Michael: What is next on your “To Do” list? What can the Tableau community expect to see from you in the near future?
Eugenia:
As a Tableau consultant and certified trainer, we always stay up to date. I’ve just recently wrote a blog about Tableau’s New Data Model which will be available in the Tableau release 2020.2 and we are also doing an internal webinar about it.
I’m generally very interested in Center of Excellence, Tableau Blueprint, enabling people and building data communities. I hope to be more involved in these projects.
