Candra McRae Bio
Candra McRae, a Seattle native and recent Columbus, GA transplant, is the founder and CEO of Lumodis, a data analytics and optimization testing consulting firm. Previously, she was the Executive Director of Analytics & Insights at Ramsey Solutions and cut her teeth in analytics at Deloitte Consulting. She received her master’s from the University of Georgia and BA from the University of Washington. In her free time, she likes to travel, discover new restaurants, and hang out with her husband Kevin and shih tzu Mimi.
Her path into analytics and experimentation was a bit windy and unconventional. Her academic training has little to do with her chosen profession and math was always something she had to really work at to understand. So, choosing a career where math is one of the main currencies seems odd. However, she feels like this has been a ‘secret sauce’ in her career because she is able to break down of math and statistics in a ‘cookies on the bottom shelf’ kind of way that helps her communicate complicated topics in a relatable way to folks where math isn’t necessarily a love language.
She chose analytics and experimentation because it’s challenging, allows her to investigate and utilize intellectual curiosity, and you can see tangible outcomes from the work. She’s passionate about helping people understand their data & solve problems with a little math, creativity, and sweat equity.
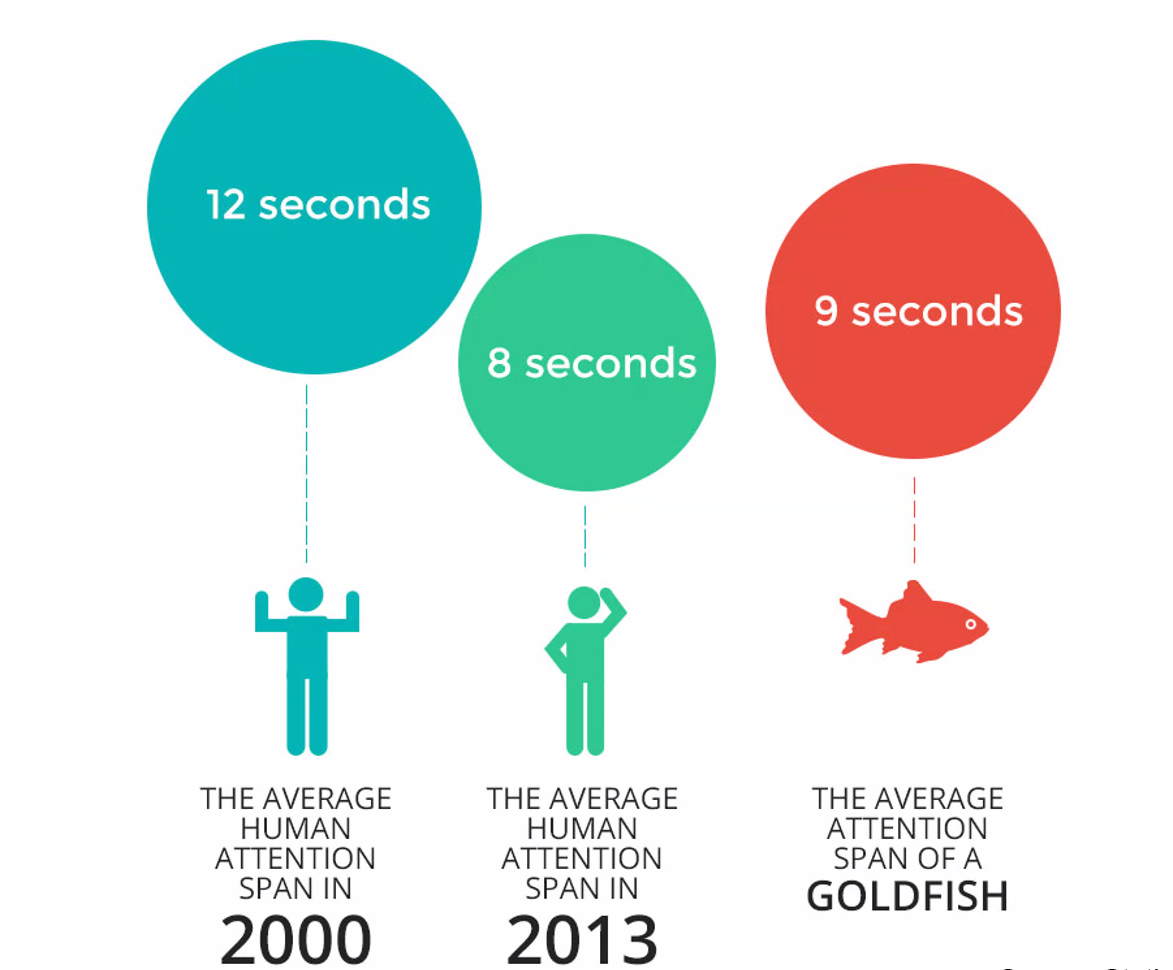
Michael: Hello Candra. I absolutely loved your presentation at the Tableau Fringe Festival – EMEA last week. Early in your presentation, you noted that our attention span has significantly decreased in the past 19 years. What do you attribute this to?
Candra: I believe a large chunk of the drop can be attributed to the increased digitalization of our lifestyles, which increase the number of things competing for our attention compared to 19 years ago. From the constant notifications on your phone telling you that you have a meeting in 10 minutes, 5 unread text messages, an insane number of new emails, and are falling behind your move goal for the day. If it’s not your phone, it’s your watch, your Google Home/Alexa, pop up ads in your browser, social media, etc. This isn’t to say anything about how our offline lives have become a little bit more complicated (e.g., higher number of extracurricular activities for your kids) that takes us space in our thoughts.

Michael: You are the Founder and CEO of lumodis. Can you tell us a little bit about your company and the kinds of services you offer in the business intelligence and analytics space?
Candra: I’ve always wanted to be an entrepreneur – the desire to leave a legacy for future generations, being my own boss and the high stakes of whether or not you added real value to someone else determined if you ate or not was always appealing to me. So, after 12 successful years in corporate America and a couple of years of doing projects on the side, I took every bit of faith in my ability to be successful that I could muster and bottled up the encouragement from family, colleagues and industry peers, and started Lumodis in July 2018.
Lumodis is a boutique consulting firm that specializes in analytics (from reporting to machine learning) and optimization testing (from hypothesis generation and prioritization to building out tests). Our broad range of services can meet clients where they are – regardless of whether they are just getting started or they have established analytics or experimentation programs and just want to go higher. In addition to a lot of technical depth, Lumodis is adept in executive strategy and program management. I think what makes us successful is we’re bottom-line focused and drive forward straight-forward, sustainable solutions that doesn’t require an army of consultants to update or understand.

Michael: You were a presenter at TC18 last year. Your topic was Deploying Tableau Online using a phased approach for SMBs. As part of your presentation, you discussed “Know what you are looking for” regarding selecting a BI & Analytics tools. Can you discuss your recommendations for evaluating BI & Analytics tools?
Candra: First, assemble a collaborative, cross-functional crew to be the evaluation team. It shouldn’t be just IT or just analytics – but analytics, IT, data engineering (if you have it). That way, everyone’s perspective and challenges are accounted for and it makes the internal conversations around the tool when it’s time to procure go by a lot faster and drama-free.
Second, understand what’s important to your organization. If you don’t know where to start, I would start with the following:
- Ease of Use: Can a person off the street be able to connect to data and build something useful with the tool
- Extensive Native Integrations: Right out of the box – can you connect to data sources with just a click or do I need to rely on your dev team to build a whole bunch of custom connectors that need to be maintained forever
- Advanced Analytics: Reporting and dashboards are nice, but can you utilize the tool for more advanced stuff like geo-spatial analysis or predictive analytics
- Security: Can I provision access to the data and related views at whatever level you deem appropriate? Also, is my data safe in the cloud?
- Total Cost of Ownership: How much does having this tool REALLY cost once you factor in administration, productivity, ancillary teams that need to support it, etc?
YouTube link to presentation: https://www.youtube.com/watch?v=zZN1Q-05d2M&t=0s&list=PL_qx68DwhYA_NN2iHc9hdIRSQl9FOIm1t&index=275

Michael: Can you discuss your phased recommendation for implementing Tableau in an organization? Can you also provide best practices or tips?
Candra: Not every business can afford to spend a lot of money at once on a BI platform – especially if their awareness of the benefits is just from the sale’s pitch. Sometimes, you must give a business a chance to dip their toe in the water – experience the benefits, then expand. So, what a phased approach to implementing Tableau can look different depending on a business’ budget, tolerance for change, and/or data maturity.
It can be a couple of desktop licenses and a combination of Tableau Explorer and Reader licenses (I’m not a fan of Reader due to the version control challenges and its reliance on manual refreshes– but it’s a free way to distribute Tableau content). Or, it could be adopting a couple of desktop licenses and getting 100 Tableau Viewer licenses – then scaling the license count as demand and content grows until everyone has Tableau at their fingertips and Tableau is embedded in the data strategy for the company.
Michael: You also presented at the Nashville Analytics Summit 2018 last year. Your topic was Avoid the Blank Stare: How to Tell Great Stories with Data.
How can we tell great stories with our data?
Candra: Telling great stories with data is half art, half science – but the one of the most important keys is knowing your audience. This will tell you where you need to start, how you need to tell the story, and what they actually care about. After figuring out your audience, answering the 5 Ws is critical to keeping their attention and not venturing into data throw up land
- What are we talking about?
- What did you find?
- Why do I care?
- What should I do?
- What are my next steps?
Make the answers to each of these questions so clear and concise that someone off of the street without a lot of context would be able to follow. Allow your audience to exercise some intellectual curiosity on the content, but do not allow so much space and ambiguity as to allow unsupervised thinking or confusion derail the major themes and adoption of the insights.
Also, leverage pre-attentive processing in the way you visualize data by making the most efficient parts of the brain do some of the explanations for you. In other words, be judicious in the use of position, color, size, and shapes so that people can more easily understand what they’re seeing. Avoid massive data tables, which can be hard to discern patterns and meaning without a lot of explanation.
Finally, save technical explanations for your peers. Yes, a conversation about Bayesian probabilities and a code walk-through is interesting, just not to executives. It’s probably a guaranteed way of losing your audience to their phones or thoughts on what’s for lunch. Executives just need to know what’s going on in their business and what to do about it – as quickly as possible. So, focus on outcomes, but have details available should specific questions come up.
Michael: What is next on your “To Do” list? What can the Tableau community expect to see from you in the near future?
Candra: Hmm… I’m trying to balance my love for and active practice of data viz with my love for data science (Kaggle practice competitions) equally – so we’ll see what happens. I wish there was more time in a day because I want to do #allthethings. But, off the top of my head
- Maintain consistent participation in #MakeoverMonday and #WorkoutWednesday.
- Join one or two more community projects. There are so many good community projects out there (#VizforSocialGood, #projectheathviz, #sportsvizsunday, and the Tableau prep one).
- Create more data vizzes on social justice topics to increase awareness.
- Providing feedback more frequently, to more people. I always shy away from this on Twitter (unless someone specifically asks) because data viz is like art and something that is purely throw away to one person can be the best thing since sliced bread to others. But, I think feedback helps the community thrive – especially from someone that has been on both sides of the table (analyst and executive).
Tableau Public
Link: https://public.tableau.com/profile/candra4181#!/