
Chris Love Bio
Chris has an extensive background in data analysis spanning 10 years; initially working in SAS and SQL, he was asked to evaluate an early version of Alteryx 8 years ago and hasn’t looked back since. Empowered by this new technology, and with an advantage over his peers who were using more traditional tools, he quickly developed a reputation from problem-solving and, in his Consultant role at a Global Information Services provider, he helped build out many complex data solutions across a range of industries. As a Development Team Lead, managing three groups of data analysts all using Alteryx, his technical knowledge and training skills were called upon daily as he led the team from the front, advising on innovative approaches to drive down development costs.
The pinnacle of his career so far came at Alteryx’s Inspire Conference in 2013 where, pitted against nine other Alteryx super-users, he competed in his first Alteryx “Grand-Prix”. Despite some stiff competition Chris raced through three business problems, against the clock, and totaled the best time overall to become the first Grand Prix winner outside the USA. Chris is also an Alteryx Ace and Tableau Zen Master.
With Alteryx adding Tableau to its growing list of Technology Partners, Chris quickly recognized that they were the perfect combination and quickly set about adding Tableau to his skill set. Tableau allowed his creativity to shine and meant he no longer had to compromise when showing off the results of his analysis.
Chris is a passionate photographer and has sold his work internationally, as well as having displayed in exhibitions and competitions. He has a passion for the outdoors and his love of wildlife and nature complements his photography perfectly.
Interview Questions
Michael: Hi Chris. Can you tell my readers what you do at The Information Lab?
Chris: Hey Michael. My role at The Information Lab (TIL) is an Account Manager, sounds rather dull and boring but essentially I can shape it how I want. I moved into the role a few years ago from consultancy when we were looking to expand our Sales Team. The role essentially consists of looking after a portfolio of customers, helping them be successful with Tableau and Alteryx and connecting them with the experts in the team at TIL. It encompasses everything from quoting and invoicing them to attending demos and delivering training. I don’t think I approach the role like a typical “sales jock” given my background, I’ve been there and implemented these solutions which lends a lot of credibility, it also means I don’t need to drag along anyone technical with me. TIL is a great company to work for because of freedom it affords us, it means I can keep my hand in by helping with customer support questions while also dealing with my day job. It also means I can work from home when I’m not visiting customers, which really helps with family life too.
Michael: A couple of years ago, you posted a blog post, From Data to Insight – Agile Tableau. Can you talk a little about this methodology and its relevance today as we prepare for Tableau v2019.1 and the introduction of Tableau Prep?
Link: https://www.theinformationlab.co.uk/2016/03/03/from-data-to-insight-agile-tableau/
Chris: Sure, so this post really came about due to what I perceive as misconceptions that many people have around how to successfully develop dashboards. Many organizations still separate the business from the Tableau “developers” and expect requirements to happen in a single meeting or document. Often our success as consultants is purely about transcending that barrier and communicating with the users. Anyone could do that but many people don’t.
Many organizations still separate the business from the Tableau “developers” and expect requirements to happen in a single meeting or document.
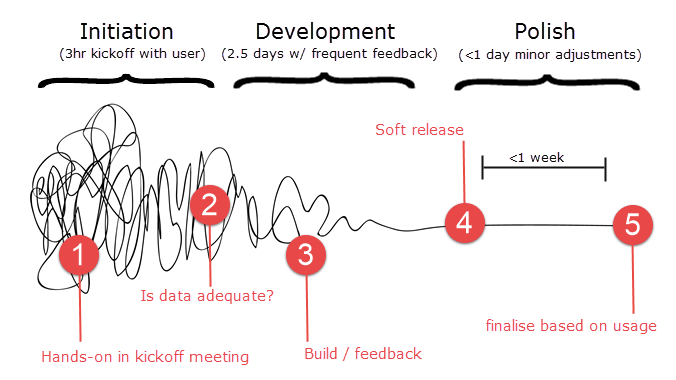
It’s as simple as that, a methodology that works around communication and iteration. It’s not as written in stone as the post implies, I don’t guarantee you’ll have a dashboard after 3 days as clearly it depends what we’re building, but the fundamentals are the same for every project.
Firstly, you sit in a room, with a PC and work live with the data. Asking questions. Many people come into a meeting like that with a preconception around what they need – we need a bar chart here and a line chart here. It’s important to leave that at the door. “Why” is the most important question you can ask. Why are we building a dashboard? Why do you need to see that figure? Often by digging into why then a very different story emerges. It’s a cliché but asking Why? Three of four times is often necessary before you get to the real need. It’s often very different to what people expect.
Once you’ve sat together and teased out the details then it’s still important to work closely together over the course of the main build phase, constantly showing and iterating – “does this do what you need?”. Co-locating analysts with the business is a key factor here. Too often analysts are but in a team near IT and they don’t sit with the business. If I was running a company the first thing I’d do is get the data people out into the business and co-located.
If I was running a company the first thing I’d do is get the data people out into the business and co-located.
Finally the most important step is to release something, asap, and see if it gets used and if it helps. Then you can polish it later.
From a Tableau Prep perspective I can’t see much changing in the way we work. The difference is that it means we can quickly pull in different spreadsheets / datasets – the number of meetings I’ve walked into where the customer has the “data” but you quickly realise it’s in the wrong format for what you need to do, or spread across multiple files.
As common example is when there’s an events table, non-data people expect it to be simple to count the open “events” at a particular time – but in reality it’s not that simple. We need to join to a date table and create a temporal table. Prep makes that sort of stuff effortless and means you can do it live in a room.
By the way, Bethany Lyons did an amazing talk on this at TC17 in Europe, it’s highly recommended – https://www.youtube.com/watch?v=nU9m2BZczkI
Michael: On your Sciolistic Ramblings blog, you had an interesting post titled On Conference Etiquette and Poor Talks. TC18 just passed, but I wanted to see if you feel these recommendations still hold true?
Link: https://sciolisticramblings.wordpress.com/2017/05/31/on-conference-etiquette-and-poor-talks/
Bad talks are the best learning opportunities you have at a tableau Conference. Why walk out?
Chris: Absolutely! Bad talks are the best learning opportunities you have at a Tableau Conference. Why walk out?
But to be honest there’s very few truly bad talks at TC, more often it’s the fact you haven’t done your homework ahead of time.
At TC, I went to a session I might have been tempted to label as “bad”, it was my fault I didn’t realize how beginner the session was. I could have left when it was obvious where the session was going but I spent the time instead watching avidly and paying attention to the message and content.
- How would I do it differently?
- What could I add from my experience?
- Putting myself in beginner shoes was this valuable? (Yes)
I came away with some great ideas on a subject I hadn’t thought about much and as someone who’s often asked to give talks then out of nowhere I had a 30-40 minute talk I could give to beginners.
We’re all of us at TC in the same boat, we’ll often
be asked to recount our experience to colleagues or TUGs, so even a “bad” talk
can be salvaged. Walking out is just rude!
Michael: Your bio mentions that you are also a photographer. I went out to your photography web site and was really impressed with your work. Can you tell my readers about your passion for photography?
Link: http://www.chrislovephotography.co.uk/

Chris: Thanks, I’m glad you liked it. My passion really sprang out of nowhere – I’ve always been a nature lover and carrying around a camera to record what I saw was a natural extension. Soon the photos were more important than what I saw – and I enjoyed the process, it’s really not unlike data visualization and I talked about it here
http://(http://chrislovephotography.co.uk/tableau/photographyforvisualisations.html).
It’s a process that like data viz uses both sides of your brain – while I’m a very scientific person who likes to understand the mechanics behind light and F-stops then there’s also the left-side design/art style around composition. That’s the side that no one can teach – that eye for beauty, you really only get that from study great photos (and visualizations) and working out what makes them look good, and then trying to replicate it.
Likewise, there’s no right or wrong, beginners to experts can compete with the same subject and come up with different interpretations. Data visualization has a lot in common with photography.


Michael: Can you tell us three of your favorite Tableau Desktop tips and tricks?
Chris: Oh gosh, I’m really not one for tips and tricks but:
Lookup(attr(Field),0) filters for Table Calcs are a must know for any half decent Tableau User.
Sorting on discrete pills in a header (and hiding the header) – again “must know” stuff
Finally knowing how to build a Sankey is a key skill….. no, I’m joking! My third tip would be how to create a Dimension Selector that doubles as a legend. Ryan Sleeper describes the method really well here.
https://www.ryansleeper.com/how-to-make-tableau-navigation-doubles-color-legend/
Michael: Now that you have attended TC18 earlier this year in New Orleans, can you tell us your three favorite things you learned there?
Chris: I spent a lot of time at Tableau Doctor and the Zen Garden this year, as well as preparing for my own talk.
The first thing I learned, or more precisely was reminded of, was just how much work we have to do to educate people on Tableau.
The first thing I learned, or more precisely was reminded of, was just how much work we have to do to educate people on Tableau. The questions I had at conference weren’t hard complex questions, they were amazingly simple. Take this one:
“Our sales guy at Tableau told us Tableau would be easy to learn, but I just don’t get it – am I missing something”.
Let’s face it – Tableau might be intuitive to some but it’s far from it for others. Teaching people the fundamentals, Blue vs Green – Measures vs Dimensions (if you think they’re the same thing, dear reader, then I’m talking about you), these are the fundamentals – it’s well worth being reminded of that.
We need to spend a lot more time at User Groups and at conference catering for that 80% who haven’t got to grips with Tableau yet.
We need to spend a lot more time at User Groups and at conference catering for that 80% who haven’t got to grips with Tableau yet. The ones for whom Tableau Calcs are a mystery. The ones that Data Art and strange edge cases don’t inspire but remind them that they don’t get it like everyone else.
The second related thing I learn every year is just how small our view of the Tableau world is through the social media lens. I meet countless Tableau staff at the conference, very few understand what a Zen Master is, let alone an Ambassador. Customers even more so, the customers we help at Tableau Doctor have no idea who I am, nor do they care. People might expect Zen Masters to be greeted on every corner at TC by people, instead, the opposite is true. Personally, I find this a very welcome and refreshing reminder that outside the cult of the Tableau Social Media celebrity no one actually cares – instead they just care if you can help them get better at Tableau. Which is all that matters at the end of the day.
The third thing I learned was how little I know about data visualization, trying to sit and judge Iron Viz I found a lot of my judgments and assumptions around what was good analysis and design didn’t agree with some of the judge’s comments and scoring. It’s a very difficult task and one that reminds me just how subjective analysis and data visualization is.
Michael: Speaking of Iron Viz, you recently participated in a BI Bakeoff along the same lines as Iron Viz? Tell us about that experience.
Chris: Well you can read about it in my blog post,
https://medium.com/@chrisluv/how-do-you-choose-a-bi-tool-2550874875ab
but to summarise it was, in some ways, very similar to Iron Viz and in some ways very different. If you can imagine Iron Viz but with three tools instead of one, and each of the competitors competing in their chosen tool. We had experts from Power BI and Qlik as well as myself representing Tableau.
I don’t want to repeat what’s in the post and so what I will say is that I think personally I was heavily influenced by Iron Viz. I chose to create a very visually striking visualization (very Iron-viz-esque), given that we were attempting to engage an audience.
I think the result, Qlik won, goes back to my point earlier – the audience weren’t a crowd of Tableau users, they were real business execs and what they liked the sight of was what they were used to – a simple 6 pane dashboard. Not my fancy pants dashboard.
Is there a lesson for us in how us evangelists show and promote Tableau?
Michael: What is next on your “To Do” list? What can the Tableau community expect to see from you in the near future?
Chris: There’s so much I want to do, I have three or four visualizations for the Data Beats project https://medium.com/@databeats I do with Rob Radburn which are half finished.
They’re hard work and I’m not much of a finisher once I’ve done the analysis and answered the question, so Rob will no doubt be persuading me to do more.
Everydaydashboards.com continues to grow. How we get more content from real-world dashboards is a challenge, as many companies are unwilling to share. My main plans are to collect together real datasets users can use, as well as practicing different methods of presentation to different audiences
Finally, I want to see much more debate around analysis and underlying techniques – how do we know the data we’re looking at is correct? How do we ensure we’re not treating it incorrectly? How do we critique others treatment of the data?
The critique and debate is a key part of our community and we seem to have lost some of that recently – I’m keen to see how we can bring it back without putting off newcomers.
