

Fi Gordon Bio
Fi Gordon is young at heart and totally passionate about data, She is a kiwi living in the best city in the world…. Sydney! Fi loves to dive and explore the vast underwater playground, blowing bubbles is where she finds her Zen.
Fi has been working with data for 15 years and has been fortunate to be introduced to Tableau. It has completely changed the way that she works, and she is hoping that sharing her story will inspire others, just as she been inspired by the Tableau community.
Questions
Michael: Hi Fi. Can you tell my readers a bit about your Tableau Quest Playbook? What was your inspiration for creating it and how it can help the Tableau community?
Fi: Thanks for having me on your blog – your guests on here are amazing, I’m humbled to be invited to chat!
The Tableau Quest came about after the perfect storm: my team was asking to use newer tech, they wanted more formal/informal training, and we could improve our speed to insight by enabling everyone with Tableau.
Part of any decent change management program is providing people with the knowledge of how they can use the tooling, and I was inspired by a keynote speaker from Tableau’s Data Day Out to make sure my team felt they had a sense of progress. I sat down with the BI crew who were already using Tableau, and we whiteboarded a bunch of challenges that would help people learn, practice, and get certified. One of the team, Sharad Joshi, suggested we turn it into a gamified program of work, sprinkling in a sense of friendly competition between the team.
We built the first iteration of The Playbook, which takes people from rookies to rockstars, helping them to level up their skills and have some fun along the way. The program was launched to the team, with a leaderboard and dozens of challenges and courses.
Turns out we didn’t get it completely right at the start, but there have been a few iterations, and the playbook that’s published on my website (available for download) is open for everyone in the community to use! CommSec hasn’t opened up the viz & leaderboard, but it’s not too hard for a Tableau Developer to create.
So far, I’ve had the opportunity to present the quest to over 400 people, in Sydney, Melbourne, and New Orleans, and a bunch of organizations have started to implement it, many with their own changes and challenges thrown in for good measure. If you’re interested in learning more about the Tableau Quest, either personally or to roll out at your organization, you can check out my recorded session here.
It can be overwhelming knowing where to start, or how to become a Tableau Rockstar, so now the community have a road map of how to level up. Anyone can do the Quest and it’s cheap! Only US$1,300 (for training and certification). Good luck!
Michael: You are a BI Strategist Director at JLL. Can you tell us a little about what you do in this position?
Fi: Great question, I’m going to be learning all about my new role which I’m starting this week! Kudos to the power of the Tableau Community, Paul Chapman suggested I might want to look at the role, and it’s shaping up to be the role of a lifetime.
JLL has a strong technology focus to drive transformation, and my role is to help build the BI strategy for their APAC Facilities Management business. I’ll be working between the business & IT, understanding client’s needs, how to create structured processes such as effective briefing, to deliver insights through data visualization and predictive analytics, driving cost down and optimizing processes where possible.
I’ve got some healthy competition, with Paul Chapman’s team who have been on the journey for a few years, with considerable cost savings – you can hear about Paul’s successes in his TC18 talk here. In all seriousness, I’m delighted to join the team, leverage some of the great work that’s been delivered in EMEA, and collaborate with them to help them out wherever possible.
Michael: I see that you are an avid scuba diver. I love stories about sunken ships and searching for hidden treasure (The Deep is one of my favorite movies). Have you had an opportunity to explore any sunken ships and do you have a unique story to tell about it?
Fi: Yes! When I’m finally ready to stop talking data, I love to dive. I’ve clocked over 150 dives, mostly in Australia and the Maldives. I have been on tiny wreck dives before, but I love a healthy reef with plenty of pretty fish & sharks! The scariest moment I’ve had whilst diving was due to an o-ring blowing, which meant I was dumping air rapidly. Fortunately, I had a great dive buddy with loads of experience. She followed the steps for a controlled emergency ascent, and we made it to the surface safely. We quickly fixed the seal, and went straight back down!
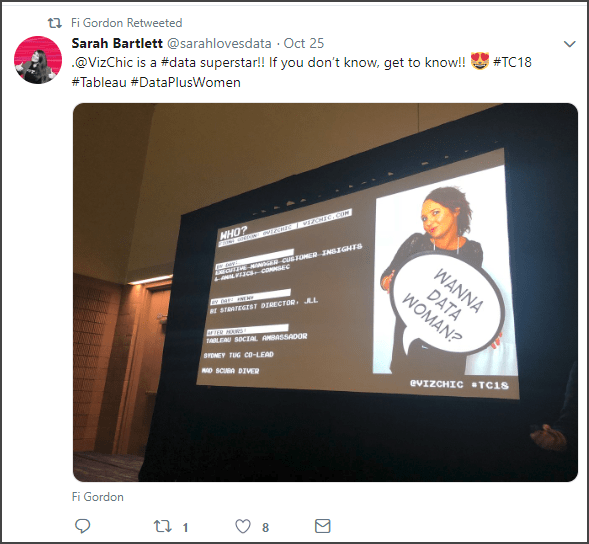
Michael: You are a Social Ambassador for Tableau. Can you tell us how you were selected as a Social Ambassador and what duties this role has?
Fi: Tableau runs an incredible Ambassador program that highlights individuals across the globe who go above the normal call of duty on social media, community forums, Tableau Public, and lead Tableau User Groups. As a Social Ambassador, I tweet and blog about Tableau. Tableau sometimes asks Ambassadors for feedback and ideas for the community, to participate in alpha and beta programs, and we are also there to lend a hand.
I was lucky to be selected a few years ago as an Ambassador by Tableau. If someone was interested in trying to be a Social Ambassador, I’d recommend that they:
- Start a blog
- Create a twitter account, and make it focused on data
- Build a network of followers
- Play to their strengths and help others out
Starting in 2018 Tableau opened up nominations from the Tableau Community to help them select new ambassadors. A committee of Tableau employees looks at all the nominations and the current group to select new ambassadors to serve a one year term. If a current ambassador is in good standing they are highly likely to be selected to stay on for another term and may be asked to help as a mentor for the new additions.
Michael: Can you tell us three of your favorite Tableau Desktop tips and tricks?
Fi: Oh, this is a toughie! My type of job typically means I don’t get to spend a lot of time on the tools, and more time spent enabling people with the right tools and strategy. One of my favorite things to do is to help people with viz critique, so I’ll give you my top tips and tricks on delivering a great viz instead:
- Nail your briefing! It’s widely accepted that data is important to help drive great outcomes, but that can mean an avalanche of work is coming down the pipe. Defining a problem statement that addresses the 4W’s: Who is affected? What is the problem? Where does it happen? And finally (the critical question to define whether the data is actually needed: Why does it matter? These questions will each help to provide the foundation for a great delivery. Once the problem statement is defined, it will lead you into plenty of questions.
- Their Shoes Not Yours! Design your vizzes by stepping into the shoes of your consumers. User empathy is an important step to incorporate when you’re developing. Are you solving your problem statement, with the minimum of information that is required? Is it easy to understand? Would someone be able to look at the viz, and quickly assess where they need to take action?Consider how you feel when you visit a poorly designed website, you’re unlikely to stay for too long, or make a purchase. The same theory applies to your visualizations. Think about what your end user will be thinking and feeling when they open your viz for the first time: will they stay for long? Will they know how to navigate? Will they return? Or will they simply shut it down because there’s too much cognitive load?!
- Great Vizzes Incorporate BANs: Big Ass Numbers!! Tableau has completed an eye-tracking study that shows people are attracted to the BIG numbers on the screen. From there, your choice of visualization will help the end user uncover insight. There’s plenty of other top tips in their research, I suggest you take a look here.
PS – if that’s not your cup of tea, I’d recommend you hit up Ann Jackson and Lorna Eden’s TC18 session on speed tipping. You’ll have over 100 tips to nourish your mind and satisfy your Desktop desires.
Michael: Now that you have attended TC18 in New Orleans, can you tell us your three favorite things you learned there?
Fi: Tableau Conference is something that every Tableau user should try to attend at least once! This year was my fifth US conference and tenth globally, and each time it’s a different experience. I had two goals for this conference network & coach: mission successful!
I had two goals for this conference network & coach: mission successful!
This year Tableau introduced the concept of Braindates: people could choose to coach, or get mentored, or have a group discussion. I offered three different sessions on data literacy, negotiation, and answering tough questions. It was a great opportunity to meet new people, and make new friends: shout out to everyone who joined me! If anyone is keen to set up a coaching session on any of the topics, I’d be happy to set up (free) 30-minute sessions.
Next up, I got to geek out with a bunch of server admins. Tableau Server is not often the golden child of the community; however, it is the way we can share and collaborate at our organizations: without it, our vizzes would reach fewer people! Tamas Foldi opened our eyes, with a great session on why extensions are very cool but could be dangerous with data leakage. Paul Banoub followed up this session with a fabulous blog, Do you manage Tableau in your organization? You must read it before deploying any software (Desktop or Server) from version 2018.2 and above (give yourself the knowledge of what could become an issue).
Adam Grant, Organizational Psychologist and Professor at Wharton University, delivered a kick-ass keynote. Adam shared many great insights, but the one that stuck out for me most was around how to avoid burnout and still get the feels for giving back. He recommended “chunking” the time you spend on helping others into close succession, rather than “sprinkling” different times throughout the week. I highly recommend checking out his website to see his ted-talks and other content.
By spending my time networking & coaching, I’ve ended up watching sessions afterward! This meant I capitalized on the time spent face-to-face and now get to prioritize the sessions that will help me the most. You can too! Head over to Tableau’s YouTube Channel to get access to all of the content
Michael: What is next on your “To Do” list? What can the Tableau community expect to see from you in the near future?
Fi: Well… there will be another TFF APAC, more Sydney TUGs, and maybe even a Singapore TUG visit?! I’m attending the Singapore Data Day Out this week – I can’t get enough!
On the horizon, I’d like to set up formalized collaboration between organizations, where we can develop out concepts in a POC, without the burden of the full cost. Let’s see how far we can push the community to achieve incredible outcomes across the globe!
Thanks again for the opportunity for being a guest on your blog – I’ve had a blast! Look forward to catching up again.
