
Greetings!
Last week, Tableau held its annual conference in New Orleans. Many new product and feature announcements were made during the conference. Boy oh boy, Tableau has some great new features coming starting next week with version 2018.3 and again in January with version 2019.1. Claire Smith and I plan on installing 2019.1 on our new sandbox server in the next few weeks so that we all can kick the tires and give it a good look.

Claire Smith Becomes A Tableau Desktop Certified Associate
While at the Tableau Conference last week in New Orleans, Claire took and passed the Tableau Desktop Associate Certification Exam. This is not just a simple exam. Tableau provides you with multiple datasets covering a variety of topics. Then, you have to sit at a computer with Tableau Desktop installed and build numerous data visualizations from scratch to answer the 50 questions on the exam. Here is an example of one of the questions.
What was the percent increase in orders for customers who placed more than 3 orders in 2013?
This is not a simple drag-and-drop problem in Tableau to solve. You need to find all customers who placed more than 3 orders in 2013. Then, you have to look at all the orders that have been placed by those customers in the following years, and then determine the percent increase.
Besides being under the stress of a time constraint of 2.5 hours, you have to solve a dozen or so of these kinds of problems and answer multiple questions for each problem. One mistake in building your workbook could mean getting an entire portion of the exam incorrect.
Congratulations to Claire for this great achievement.
Tableau Announces Major Changes to the Tableau Suite of Products
Here is a description of some of the key changes and when each change will be released.
Take note that one of the new features will be the ability to export to PowerPoint, and to hide all of the filters where you can toggle them on and off.
- Vector maps and map styles (coming in 2019) — Maps are incredibly important visual analytics tools. To offer more detail and responsiveness, Tableau is updating their background map technology to use vector tiles. Vector maps are fast and fluid, with the ability to zoom in on different areas of interest to demonstrate how smoothly map features scale—like contours and building footprints. Additional map layers, including satellite images, will bring more context to your data.

- Navigation buttons (Tableau 2018.3) — Want to offer a guided experience between dashboards, sheets, and additional resources? Dashboard buttons provide a simple way to navigate from one piece of content to the next, like switching between different sheets, so it’s easier to build dashboard applications.
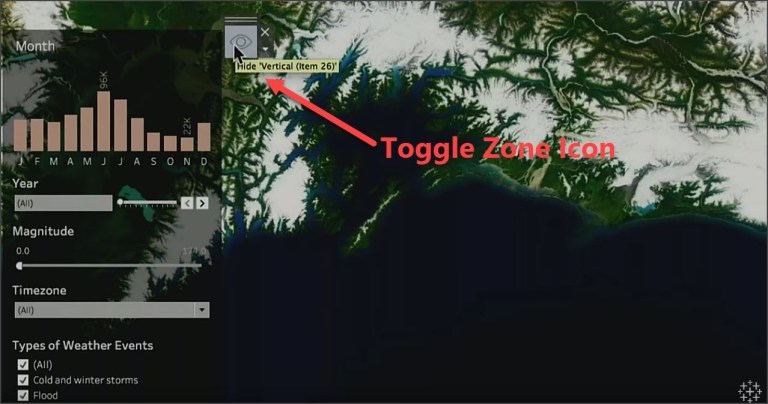
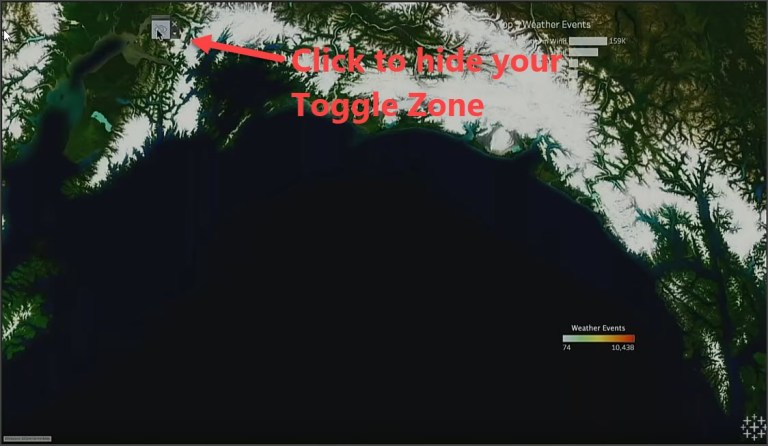
- Toggle zone visibility (coming in 2019) — Speaking of hiding: Tableau’s new toggle button allows you to hide a dashboard zone until it’s needed. This is especially helpful as more filters are added to dashboards. With a button, a single click makes zones, like a series of filters, disappear or reappear. Wax on, wax off—it’s that easy.

- Export to PowerPoint (Tableau 2019.1 beta) — To support more traditional reporting use cases, Tableau is adding export to PowerPoint. In a few clicks, vizzes can be exported into a full deck. You can export to PowerPoint to quickly add static images of your vizzes to your important presentations.

Collaborate and get insights anytime, anywhere
Tableau also showed us new ways to enable secure data access—on and offline.
- Redesigned Tableau Mobile app (Tableau 2019.1 beta) — Tableau announced a totally redesigned mobile app experience! It’s more secure and easier than ever to use. Users are prompted with new biometric identification (including Touch ID or Face ID) which is easy to enable Server-wide.
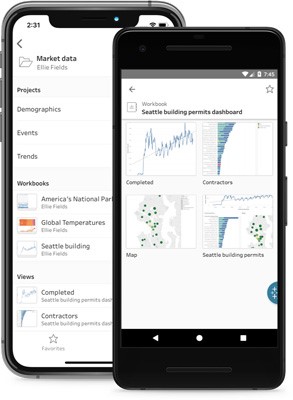
A new browsing experience was added to the Explore tab, where you can access recent vizzes and explore content within projects. You can also go into airplane mode to use interactive offline previews, grabbing vizzes to scroll, highlight, and see tooltips—all without connectivity.
- Automatic phone layouts (Tableau 2019.1 beta) — To make your vizzes phone-ready from the get-go, Tableau has introduced automatic phone layouts. Using a new smart algorithm that makes the best design decisions for a mobile layout so you don’t have to. Then, you can customize the layouts if you’d like.

- Tableau Public attribution (Coming in early 2019) — Tableau heard from their Tableau Public community that they want to cite sources of inspiration for new masterpieces on Tableau Public. And now you can. The new Tableau Public attribution feature links to a source viz and its author’s profile.
Get from secure data to analysis even faster
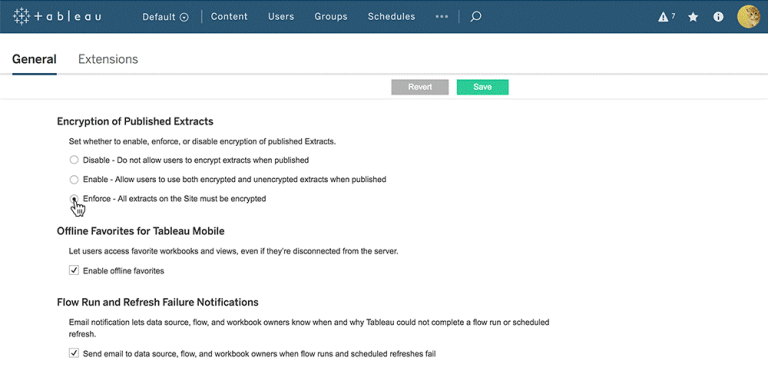
- Encryption at rest for extracts (coming in 2019) — Add an additional level of security with a click of a mouse. Tableau is improving data security by adding encryption at rest for extracts. Coming soon, extracts will be encrypted while they are stored on disk on Tableau Server. You can delegate the choice of encryption to data publishers or enforce encryption for all extracts across a site.
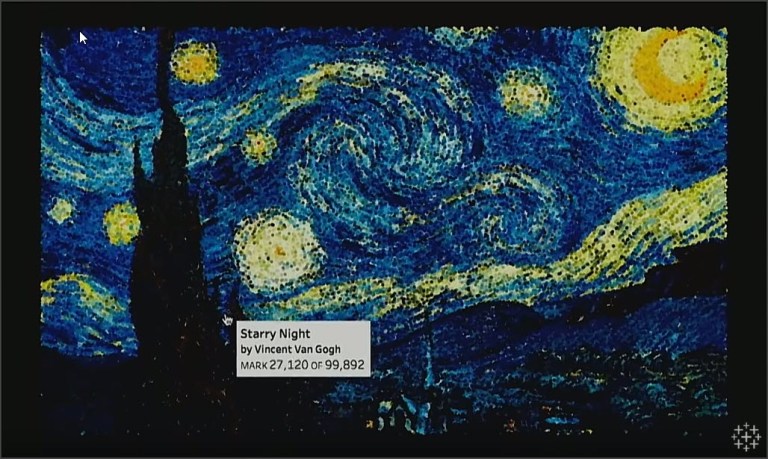
- Multiple table storage for extracts (Tableau 2018.3) — Using multiple table storage for extracts, Tableau showed us faster extract creation and viz rendering times for an impressive Van Gogh Starry Night viz (see screenshot below). When creating an extract, you can now choose to mirror the table structure of the data source within the extract, rather than storing the data as a single table within a Tableau Data Extract. With multiple table storage, Tableau only queries the tables it needs in the extract.
Extend and customize Tableau with greater flexibility
Following last week’s announcement of newly created Tableau Developer Program, Tableau shared some of the ways they are empowering their developer community.
- Webhooks (in Developer preview now) — Tableau wants to empower developers to stay on top of events in Tableau Server and Online, so they are introducing support for Webhooks! Webhooks can be used to configure server notifications to create a ticket in ServiceNow when a password change caused an extract failure. You can also generate a notification in Slack to alert your team when a new dashboard was published in one of your favorite projects. With Webhooks, the customization possibilities are endless, and you’ll never miss an event again.
- Show and hide for the Extensions API (coming in 2019) — Tableau added the ability to show and hide dashboard extensions to their extensions API. During Devs on Stage, they showed a great example of an extension that allows you to write back to an inventory management system. The write-back zone is hidden until needed, so it doesn’t take up valuable space in the dashboard.
- Extensions gallery (Tableau 2018.2) — In August, Tableau launched dashboard extensions, empowering developers to build custom applications for Tableau. Their growing Extensions Gallery is the place to find new extensions to give your dashboards superpowers. During Devs on Stage, they showed us some extensions in the works, like one that brings DataRobot machine learning models right into Tableau to help you identify key factors.
Analyze with more powerful, visual interactivity
Tableau is excited to see the creativity of the community unleashed on some new features that act as analytical building blocks, bringing interactive, visual analysis to life in new ways.
- Parameter actions (coming in 2019) — Parameter actions place a selected mark’s value into the parameter, updating any vizzes and calculations that use that parameter to drive interactive visualizations. They showed us a practical application with a time series comparison, making a year-over-year analysis simple and interactive. With a data set on smoking rates across the US, they also demonstrated how selecting a mark for the state of Alaska in 2010 adjusted the reference lines across the sparklines for every other state. Parameter actions make visual, quantitative comparison much easier and faster—and that’s just one of the many ways this new feature can be used!
- Set actions (Tableau 2018.3) — While a parameter holds a single value, sets hold multiple values. With set actions, you can change the members of a set with clicks, driving both vizzes and calculations to respond instantly with a selection. One application for this feature is proportional brushing. Another, they showed us with stock data, allows Tableau to do easy point-in-time comparisons.
With each click, the set updated and the Tableau calculation engine took care of the rest. Set actions make table calcs, reference lines, and custom SQL all interactive.
Tableau Version 2018.3 Features
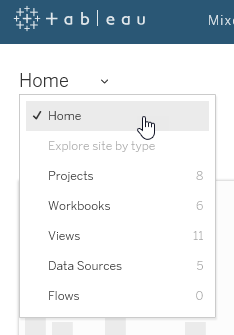
Mixed Content – With Mixed Content, Tableau Server has made it easier for you to find the workbooks and data sources you need. The new experience gives you the option to see projects, workbooks, and data sources in a single list. No more having to switch between viewing Projects and Workbooks.

JDBC Driver-Based Connections – Tableau is adding support for using JDBC driver-based connections similar to the Other ODBC functionality in Tableau today.
Normalized Extracts – Normalized Extracts is a new performance feature for extracts with one or more join statements. Now, extracts can be created with a “Multiple Table” schema so that individual tables can be stored in the extract file before they are joined together.

Worksheet Transparency – Now you can enable set the background of a worksheet to transparent.
Sort Dialog Update – In Tableau 2018.3, Tableau has updated the user experience of the sort dialog to improve usability.

Rearrange Layout Button – The Rearrange Layout Button will run Tableau’s new Auto-Generated Layout algorithm and quickly optimize your custom phone layouts.
Tableau Help Updates – Tableau made some updates to the look and feel of Tableau Help, to make it easier to find what you need.
Dashboard Navigation Buttons – Add easy navigation from your dashboard to another dashboard, sheet, or story.
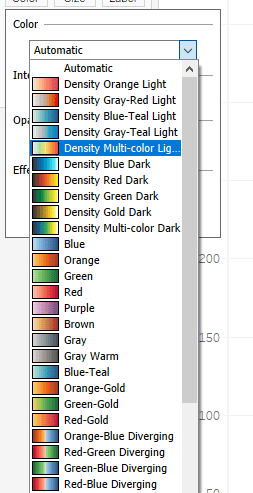
Density Mark Type (Heatmap) – Tableau introduces heatmaps, a powerful new mark type, to Tableau. With one click, turn millions of marks into a meaningful representation of your data. Understand where there are concentrations of points, and identify patterns in seconds—whether on a map or scatterplot.

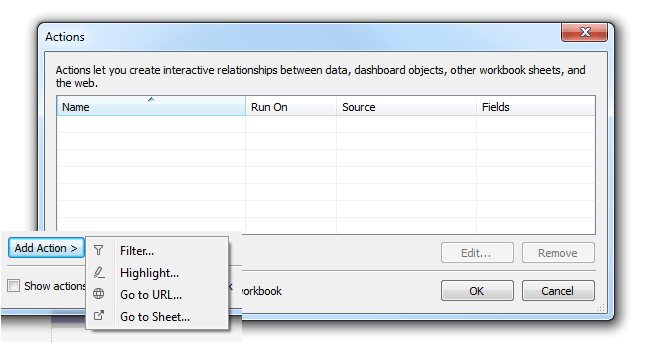
Navigation Action – Tableau brought a new action type to Tableau. Easily add navigation between sheets with the navigation action, now available as an option in the actions dialog.

Increased Column Limit for Tables – In v2018.3, Tableau has increased the upper bound on the column limit, allowing users to create tables with up to 50 dimension columns.

Spatial Data Updates – ESRI Geodatabase, KML, and TopoJSON support. Tableau now supports new spatial file connections to ESRI File Geodatabases and TopoJSON files. Tableau updated the spatial file connector to support KML files with multiple layers.
Tableau Mobile for Citrix XenMobile and Microsoft Intune – You can now add MDM solutions Citrix XenMobile and Microsoft Intune via AppConfig for Tableau Mobile.
Tableau Mobile for Blackberry – Blackberry customers are now able to deploy a special version of Tableau Mobile that is compatible with the Blackberry Dynamics MDM platform.
Sources:
–, Tableau Conference 2018: Devs on Stage, Tableau Software, Tableau Conference 2018, New Orleans, LA, October 24, 2018.
McShane, Ryan, Spotted at #TC18 Devs on Stage: vector maps, a redesigned mobile app, parameter and set actions, and Sasquatch, Tableau Software, Tableau Community Blog, October 24, 2018, https://www.tableau.com/about/blog/2018/10/tc18-devs-stage-96448#W2osveTriZEab5mk.99.
