
Readers:
This is a requirement we have had for a while from our internal business partners. Through some experimentation and Googling various posts and articles in the various Tableau forums and web sites, I was able to achieve adding page breaks and page numbers into a Tableau worksheet (or view) which I was able to use when I created a PDF file. In my discussion below, I will show you how I did this.
If you want a copy of the workbook I use as an example, please e-mail me at Tableau@cox.net and I will send you a copy of it.
I hope you find this example helpful.
Thanks,
Michael
Update: I have had several requests recently for the Tableau Workbook I used in this blog post. I have posted the workbook on Tableau Public. You can see it by clicking here.
Adding Page Breaks and Page Numbers in a PDF file
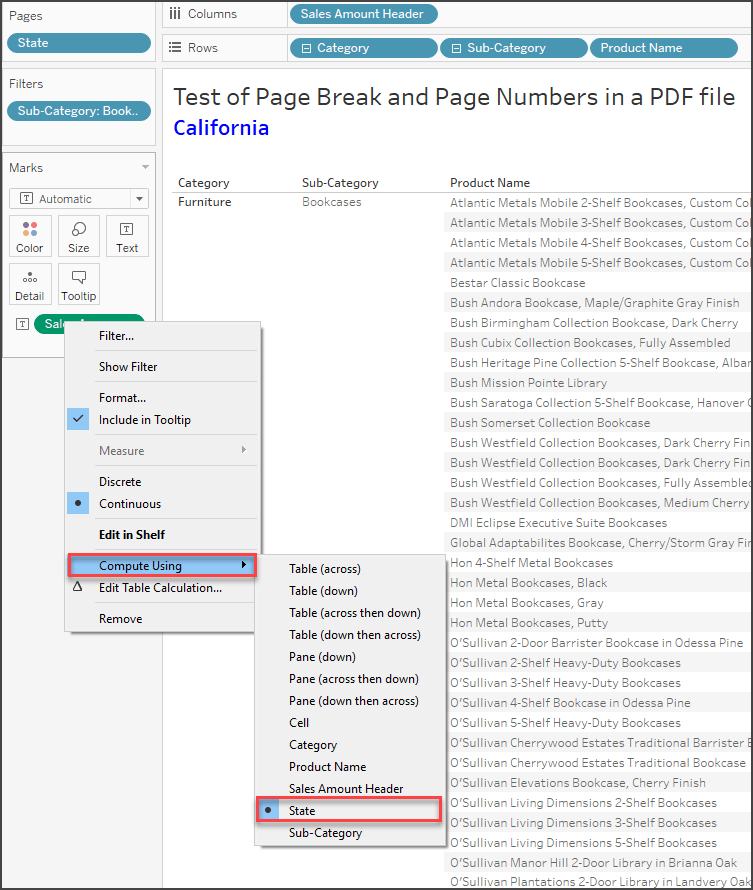
First, using the Sample – Superstore data source, create the following worksheet.
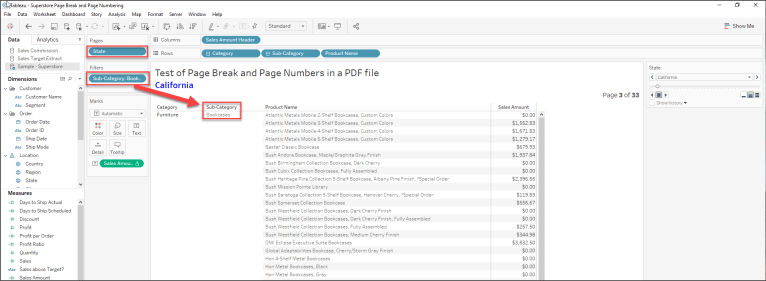
Notice I dropped State in the Page Shelf and I set Sales Amount to Compute Using State (see screenshot below). I also filter on the Sub-Category Bookcases.
Now, before I go on, left me first discuss what the Page Shelf does.
Page Shelf – An Introduction [1]
The Pages shelf lets you break a view into a series of pages so you can better analyze how a specific field affects the rest of the data in a view. When you place a dimension on the Pages shelf you are adding a new row for each member in the dimension. When you place a measure on the Pages shelf, Tableau automatically converts the measure into a discrete measure.
The Pages shelf creates a set of pages, with a different view on each page. Each view is based on a member of the field you placed on the Pages shelf. You can easily flip through the views and compare them on a common axis, using the controls that get added to the view when you move a field to the Pages shelf. For example, the view below shows the Profit vs. Sales by Region for each day throughout the month. The image below shows days 1, 2, 3, and 4. You would have to scroll down to see other days in the month.
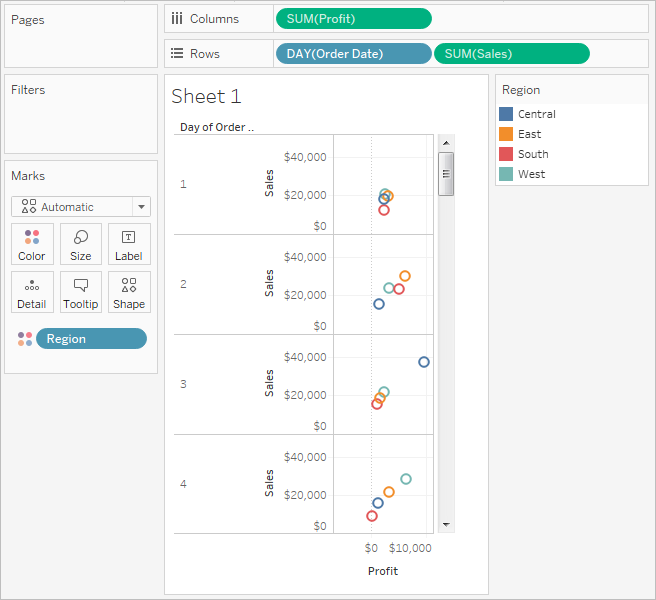
To make this view more user-friendly, move DAY(Order Date) to the Pages shelf and use the associated control to flip through the pages (one for each day). You can quickly discover hidden insights. In this example, it is interesting that the 19th is an especially big day in terms of sales and profit in the Western region.
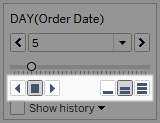
When you add a field to the Pages shelf, a page control is automatically added to the right of your view.
Use this control to navigate through the pages. There are three ways to navigate through the pages in a view:
- Jump to a specific page
- Manually advance through the pages
- Automatically advance through pages
Jump to a specific page
Select the member or value you want to view from the drop-down list to display a specific page.
Manually advance through the pages
You can manually advance through the sequence of pages by doing any of the following:
- Use the forward and back buttons on either side of the drop-down list to navigate through the pages one at a time.
- Use the Page Slider to quickly scroll forward and backward in the sequence of pages.
- Use any of the following keyboard shortcuts to scroll forward and backward in the sequence of pages.
F4 Starts and stops forward playback SHIFT + F4 Starts and stops backward playback CTRL + . Skip forward one page CTRL + , Skip backward one page On a Mac, these are the equivalent keyboard shortcuts.
F4 Starts and stops forward playback Shift-F4 Starts and stops backward playback Command-period Skip forward one page Command-comma Skip backward one page
Automatically advance through pages (Tableau Desktop only)
Use the playback controls to watch a slide show of the pages in the view. You can play forward or backward, and stop the playback at any time. You can control the speed of playback with the speed controls in the bottom right corner of the control. The smallest bar indicates the slowest playback speed.
Show the Page history
Show page history using the Show History check box. With page history, marks from previous pages are shown on the current page.
In Tableau Desktop only: Open the drop-down control for history to specify what marks to show and when to show them.

The history drop-down control has the following options:
- Marks to show history for – select whether you want to show history for just selected marks, highlighted marks, marks that you’ve manually selected to show history for, or all marks. To manually show history for marks, right-click (control-click on Mac) the mark in the view and select an option on the Page History menu.
- Length – select the number of pages to show in the history.
- Show – specify whether to show the historical marks, a line tracing through the previous values (trails), or both.
- Marks – format the historical marks including the color and how much to fade them if the color is set to automatic, the marks will either use the default mark color or the color encoding on the Color shelf.
- Trails – format the lines that are drawn through the historical marks. This option is only available if Trails is selected in the Show options.
Page trails may not display if there are multiple marks per color on a page. Make sure that the level of detail for the view is less than or equal to the level of detail on the Pages shelf and on the Color target. Also, trails are only supported for discrete mark types such as squares, circles, or shapes. They are not supported when the mark type is Automatic.
Pages on dashboards (Tableau Desktop only)
When a dashboard contains multiple views that use the same field on the Pages shelf, you can control all of the views with a single page control by selecting the Synchronized option. This option is only available on the page control shown on a dashboard.
O.K., back to my example: Adding Page Name and Page Numbers
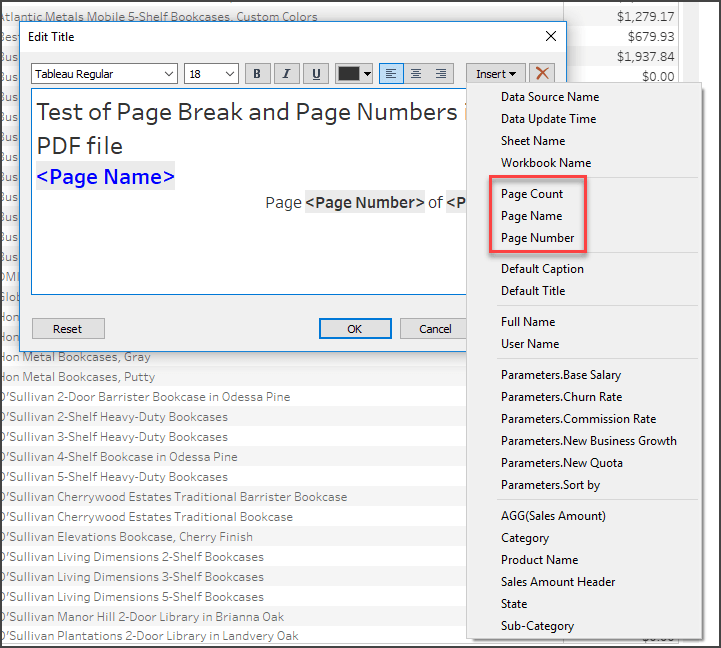
Next, I want to add the State to the top of each page in the title as well as the page numbers (see screenshot below).
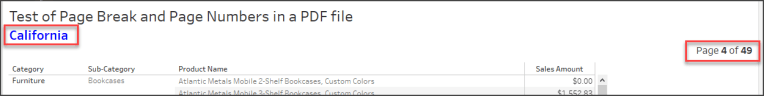
If you double-click on the title, you can add the State name for that page as well as the page numbers.
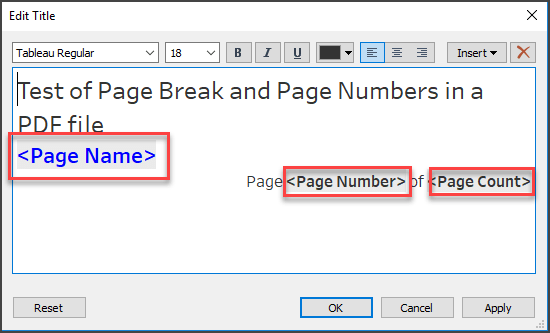
Page Name is the current page’s State name.
Page Number is the current page’s page number.
Page Count is the count of the total number of pages.
Here is how I formatted the title of the worksheet I showed in the example above.
Page Setup
Now, you need to change some settings in the Page Setup. You get to the Page Setup by using the File->Page Setup… menu options.
You want to make sure Break pages on pane boundaries is checked.
You also, want to make sure the radio button for Show all pages is selected. Notice, in the screenshot below, the panel shows you how many actual pages there are going to be in your PDF file.

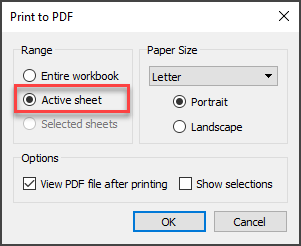
Print to PDF
Now, you need to set some of the settings to print the PDF file. You get to the Print to PDF by using the File->Print to PDF… menu options.
Make sure you have the radio button for Active sheet selected.
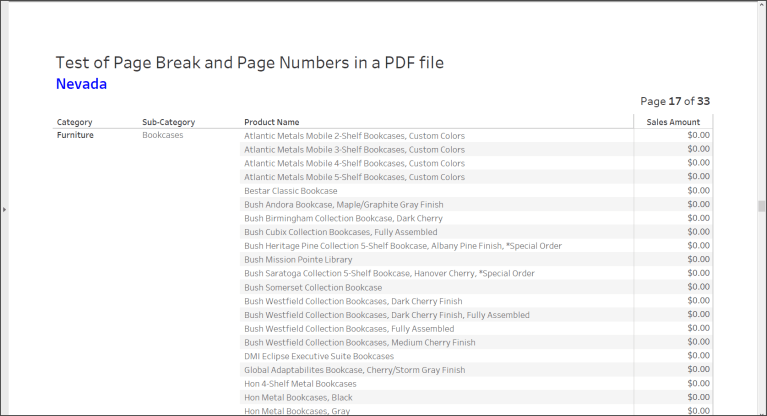
Voila!
Here are screenshots for two of the pages of the generated PDF file, Arizona and Nevada. Notice the Page Name in the title and the correct Page Number for each page. There are not pages for all 50 states since we filtered on the Sub-Category Bookcases.

Sources:
[1] –, Page Shelf, Tableau Software, Tableau Online Help, Shelves and Cards Reference, https://onlinehelp.tableau.com/current/pro/desktop/en-us/buildmanual_shelves.html.

Thank you for this information. I have needed to create a report for all Salespersons that gave me a page break and this did the trick. The only piece of information I am missing is a Group that gives the totals for everyone. (i.e., the Grand Total). Is this possible to add as a separate page?
Unfortunately, the Page Shelf looks at the dimension provided and page breaks them separately. The way I have handled this in the past is to create a second worksheet that has a Grand Total (in your case, for all Salespersons). This provides a a single grand total row on that page. When I print to PDF, I have it select all of the worksheets, so this worksheet (page) will print right after the ones from the Page Shelf. Please try this and let me know if it works for you. All the best. Michael
Hi Michael, thank you so much for your information. I am trying to mini a SSRS report by provider location in Tableau and export to PDF. For example, same provider may have multiple locations. The first page is summary level of all locations and the second page and after show the break down by individual location. I wonder if it is possible to do it on Tableau? If yes, can I use the method you posted here? Thank you.
Hmm. Here is a link to Luke Stanke’s blog about creating pagination in Tableau. Perhaps this will help.
https://tessellationtech.io/table-pagination/
Best wishes,
Michael
Thanks for the information. I also need to scheduale it in emails. Can you please help me on this.
Hi MICHAEL, Thanks for the information.
One question, is there a way to hide the Category/Subcategory/Products which have no sales in a specific state? I mean there are so many rows which are not needed, with $0.00 values.
You may want to trying adding a Boolean calculated field where Sales > $0. then pull it in the Filter shelf and set to True.
Hi
I have same requirement to have page number but i don’t need to put state on page shelf. will it still work?
Hey Michael!
Thanks for sharing – this is a very clever solution.
I did try to filter out the sales = 0, however, Tableau does not seem to be evaluating this Boolean at the correct level. It seems that the Pages shelf does not remove data from the view, it just “visually” segment the worksheet. Do you know any tricks to hide the rows with sales = 0?
Do you know if it is possible to add a image to the PDF export? I’m looking to include a logo in the top corner on each of the pages.
Thanks!
I have the same issue/question as Sandeep and Joanna . . . . is there any way to get a pdf page break on the State without showing the same Products on every page? In my data set, the ‘Product’ list for each ‘State’ would be different so it doesn’t make sense to repeat the same list of Products on every page.
It seems that the utility of the Pages feature is just very limited for tabular content.