Mark Bradbourne Bio
Mark Bradbourne has worked in the data warehousing and business intelligence arena since being introduced to the practice in 1997. He has worked on the complete life cycle but enjoys the “user-facing” roles most including requirements gathering, visualization, reporting and user training. He has worked for many companies across many industries including financial, manufacturing, internet and legal.
Mark is a graduate of the University of Akron with degrees in computer programming as well as business and organizational communication. He received his Certified Business Intelligence Professional (CBIP) certification from TDWI in February of 2011 in Business Analytics. In 2017, he passed the Tableau Desktop Qualified Associate exam, and this was honored with the title of Tableau Social Ambassador.
Mark and his wife Rose, along with their two daughters live in the Cleveland area of Ohio. In his free time he enjoys motorcycling, travel, disc golf and drumming. He is a life member of Kappa Kappa Psi and an honorary member of Tau Beta Sigma.
QUESTIONS
Michael: Hi Mark. I really enjoyed your presentation at the Tableau Fringe Festival – APAC last week. Can you tell my readers a bit about your Tableau Doctor Practice that you initiated at work? What benefits have you seen from implementing this program?
Mark: Thanks! I really enjoy the Tableau Fringe Festival and have been lucky enough to have been picked to speak at the last two for EMEA and APAC.
At KeyBank, Tableau as a platform is relatively new, having been rolled out in March of 2017. I joined the organization in July of 2017 and part of my role was to help drive adoption and education. After I attended the 2017 Tableau Conference I had the idea to launch and internal “Tableau Doctor” program. I put together a quick summary of what I wanted to do and what I thought the benefits would be. After discussions with the BI&ACC (Business Intelligence and Analytics Competency Center) we decided to launch it and see how it went… almost a Proof of Concept. With only myself acting as the primary doctor, we set really modest goals; 48 sessions during 2018. We launched in February/March and since then we’ve completed over 100 sessions. It’s a very popular initiative and the feedback has been outstanding.
At a high level, as developers run in to issues or want advice, they can schedule and appointment through a SharePoint form. I’ll take a look at the description they provide of the issue and schedule a time block. Anywhere from 30-60 minutes generally. If we are in the same location, we can meet in person, but most sessions happen via WebEx. During the sessions I can walk them through the process, point them to internal or external reference materials, or in some complex cases I can do development directly on their workbook and explain the process as I come up with the solution.
The benefits vary, but I’ve seen users who have made multiple visits and weren’t so sure about the tool then become much more comfortable. I recently had one user present at our internal User Group and she showed all the tips and tricks she’d learned and shared with her team. So, she has become comfortable enough to teach others. To me, that’s fantastic and the ultimate goal; an Army of Tableau Ninjas.
Michael: Last January, you posted a blog titled The Importance of Feedback and Iteration. I found this post to be important and insightful. Can you discuss this a bit and why you feel it is important to iterate and get feedback when working on a project?
Link: http://sonsofhierarchies.com/?p=480
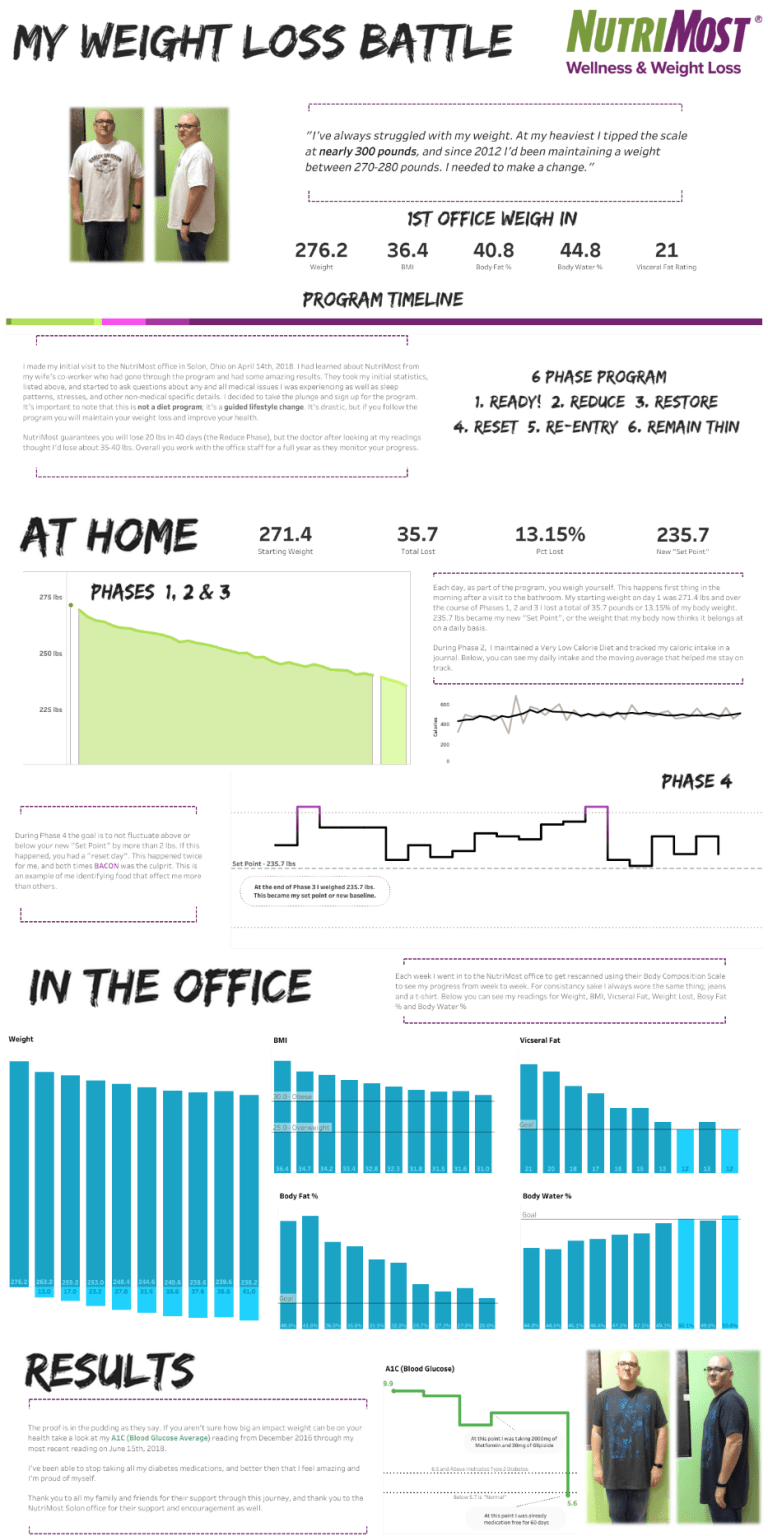
Mark: It’s really become crucial to me. Whether it’s an internal project at work, a makeover Monday viz, an Iron Viz feeder or even a blog post… getting someone else’s eyes and feedback is essential. We are creatures of habit and we have set things in our mind about how things should look, feel and function. We fall in to that trap and the audience may not, and chances are will not, have the same experience, knowledge and background as you. They don’t understand the way you think, and the message could get lost. A good example of this was my Iron Viz entry I did on my recent weight loss. I showed the viz to my wife with a very confident “What do you think?” She totally sunk my battleship and said it didn’t really flow, parts didn’t make sense and certain parts needed to be reworked. She’s a fifth grade teacher, not a data person so it made me take a step back and rework the story. To me, I had lived the entire thing so it all made sense, but to her it needed a beginning, middle and end. Ultimately, that’s what I ended up with and she could then follow it much better.
Michael: In your LinkedIn bio, you state the following:
Perform proof of concept development work for internal departments of the bank to show them “The Art of the Possible” in regards to Tableau and analytics.
What is the “The Art of the Possible”?
Mark: There is a saying “You don’t know what you don’t know” and the same is true with analytics. If a department has always looked at a “wall of number” in Excel or a series of pie charts to compare period to period they may not know that are more efficient, or more visual ways to present data and derive insight. So, what I do as part of the BI&ACC is I will receive their data, and a set of questions they want to answer with that data. I’ll go off and build proof of concept dashboards and become their “Art of the Possible”. The hope of this is to inspire them to rethink their approach to data and how they use it in their day to day business practices.
Michael: Can you tell us three of your favorite Tableau Desktop tips and tricks?
Mark: Only 3? O.K., they aren’t super fancy, but I use them a lot. The first is the ability to take part of a calculation you are working on in a calculation window and copy to the rows or columns shelf to see the result. This is super handy when you are doing nested calculations.
The second is using actions as a menu. Using Filter Actions, I create a worksheet that has a custom shape, then build a menu to navigate across multi-dashboard workbooks.

The third would be using parameters to drive highlighting. On the Big Mac Index I did as part of Makeover Monday, you can see I use a drop down parameter to change what row is highlighted to compare to the U.S. Big Mac cost.
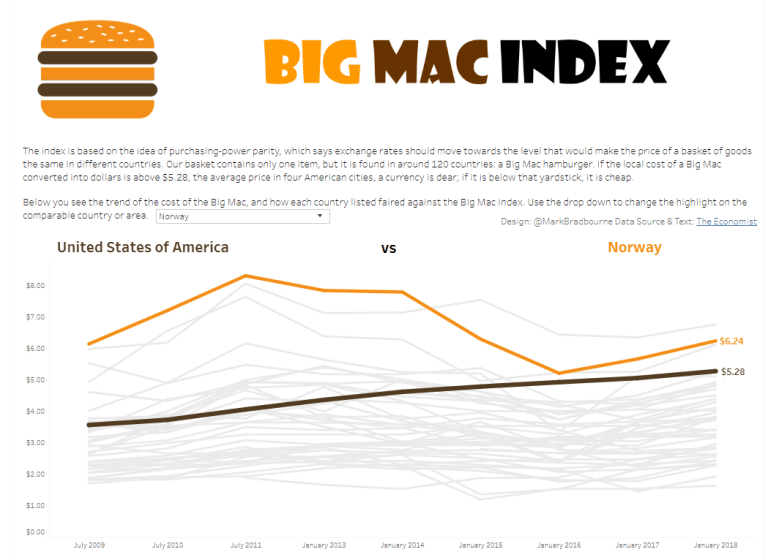
Link: https://public.tableau.com/shared/GX54Z6ZN5?:display_count=yes
Michael: TC18 is two months away. In your blog post you recently posted, #TC18 ~ Planning for Before, During, and After the Conference, you provide some ‘Alternative Tips’ for maximizing the conference before you arrive, while you are there, and when you go home. Can you provide my readers a summary of these tips?
Mark: In brief. Go with a goal in mind. There is so much you can do, but you can’t do it all. Pick a path but have an alternate. The biggest mistake I made the first time was not realizing what sessions were recorded, what session I could take home and do on my own (Hands-On) and what sessions were ‘Do not miss!’. If you aren’t sure as you are planning, ask!
Once you are there, do your best to keep your phone charged. Take notes on sessions so you don’t forget those magic nuggets of knowledge… and while I don’t mention it in the blog post, ignore work. You are at the conference to learn. It kills me when I see people on conference calls, or they are building PowerPoint presentations. If you aren’t able to 100% (or near 100%) immerse in the conference you are going to miss out.
Also, as awkward as it may feel, just put yourself out there. Say hello to random people, or a name you recognize. Make a friend or 50… it enriches the experience.
If you’ve done it right, you will be sad after the conference it over. Not only is it an amazing learning activity, but it’s a ton of fun. When you get home, review your notes and download the extra content that you didn’t manage to see while you were there. Share what you learned and experienced with your co-workers or your local Tableau User Group; the best way to absorb knowledge it to share it with others!
Michael: Tell us a little bit about the Sons of Hierarchies.
Mark: This makes me laugh to think about the origins. When I attended the 2015 conference in Las Vegas I was just starting to get involved with 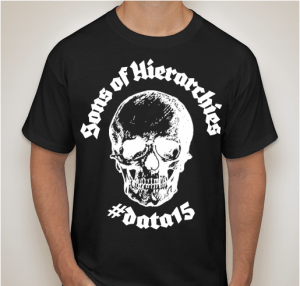
the online community. I worked for Harley-Davidson at the time and the team that was going out with me had planned to rent some motorcycles and ride out to Hoover Dam and through the desert. Dan Montgomery (@DanRMonty) posted about renting motorcycles and ride and included the hashtag SonsOfHierarchies. I responded, telling him our riding plans and I was apparently feeling creative and came up with an initial design for a logo.
The conversation continued and Aaron Romeo and I decided to sell some shirts as a laugh and gave the proceeds to the Tableau Foundation. After Data15, I wanted to set up a Tableau blog, so I registered the domain and the rest is history.
Michael: What is still missing from Tableau Desktop (assume we are talking about the latest iteration v2018.2) and why do we need it?
Mark: I’d like to see Multi-Value parameters. I think in some instances it would be nice so you don’t have to build simple matrix of values to crowbar that when needed (Select A, B, C, A and B, A and C, or B and C.)
Personally, I’d like a CSS-like functionality where I can set default color (not Blue) and Fonts every time I go in to Desktop. It would save me a bit of time as I go through every format setting to set those things.
Lastly, I’d like to see some global setting on Tool Tips, mainly an option to disable command buttons on all tool tips.
Michael: What is next on your “To Do” list? What can the Tableau community expect to see from you in the near future?
Mark: I personally want to continue to learn and grow and if I inspire a few people along the way that’s awesome too. This year I became a collaborative blogger with Mark Kernke and Mark Jurries II, cleverly knows as The Data Marks. Next year, I want to see that project take off and find a good rhythm with projects and challenges. I plan to continue to grow the Cleveland Tableau User Group with Jeremy Paytas and Mark Rogozinski and have it help raise the overall Tableau talent pool in Northeast Ohio. Lastly I want to complete the TFF trifecta and speak at TFF – Americas and while I got close this year, I want to speak at the Tableau Conference in 2019…. topic to be determined.
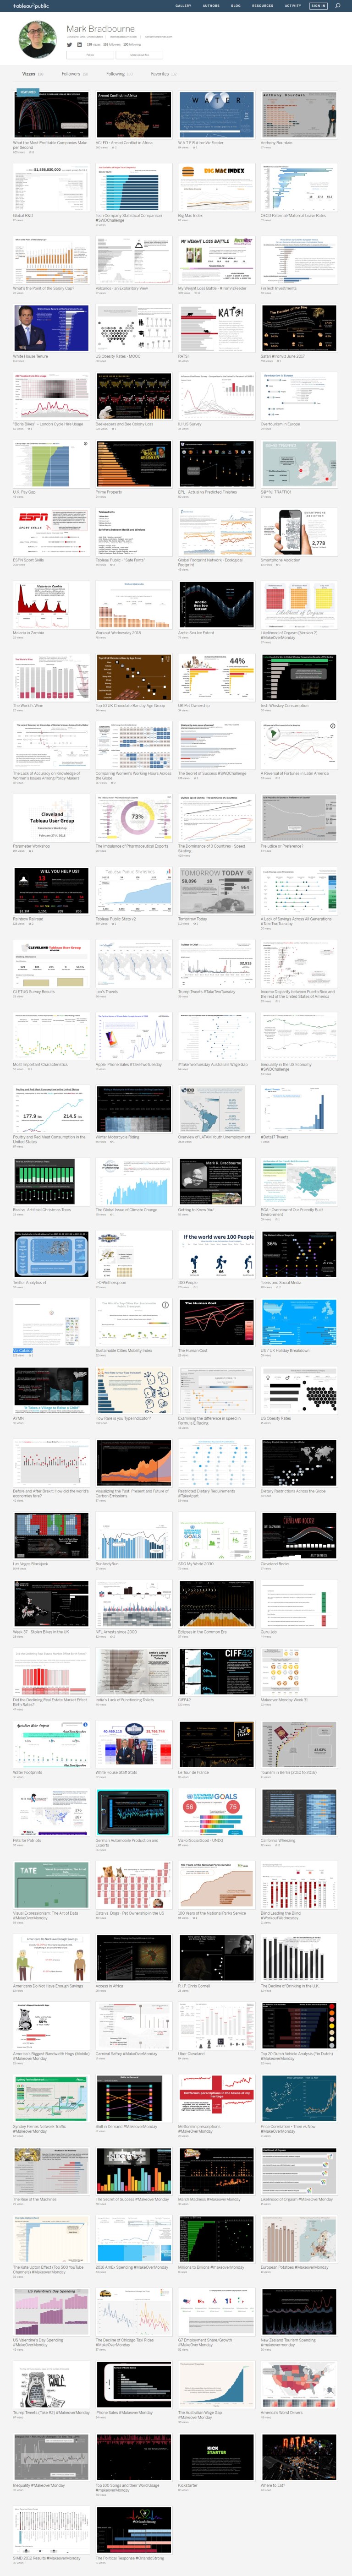
Tableau Public Link: https://public.tableau.com/profile/mark.bradbourne#!/