

Readers:
My friend Chuck sent me this article on income inequality for my blog. I think it is an important and timely topic to discuss.
Mona Chalabi (photo, right) published an article in The Guardian back in April. She was responding to a question she received via her e-mail regarding “How would someone go about checking wage gaps? How can you check for gaps across genders and across racial/ethnic groups?”
Mona cited the fact that the question was timely in that April 4th was Equal Pay Day. She noted that the date was symbolic – it showed roughly how many days of 2017 women need to work to earn as much as men did in 2016. Tuesdays are symbolic too, they represent “how far into the next work week women must work to earn what men earned the previous week”, according to the National Committee on Pay Equity.
Unfortunately, there are a lot of naysayers regarding income inequality out there. Chalabi cites several examples include a Time Magazine article titled 6 Feminist Myths That Will Not Die that was written by Christina Hoff Sommers in September of 2014.
Sommers states, incredulously,
Much of what we hear about the plight of American women is false. Some faux facts have been repeated so often they are almost beyond the reach of critical analysis. Though they are baseless, these canards have become the foundation of Congressional debates, the inspiration for new legislation and the focus of college programs.
However, Ms. Chalabi’s focus, in her writing, is in providing or disproving statements such as these. Here is how she did the math to prove that income inequality exists.
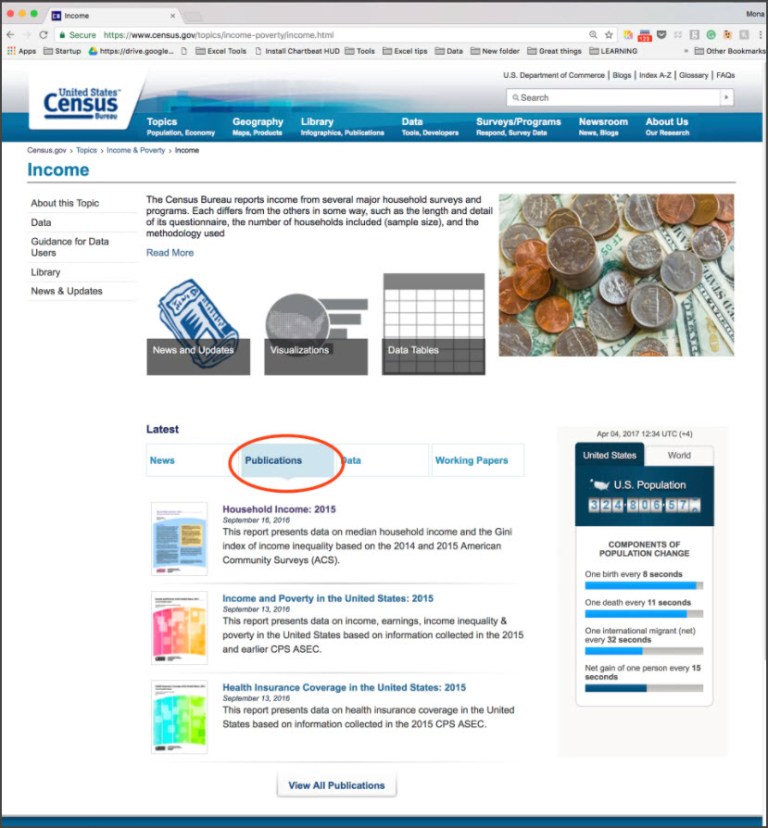
The first thing she did was find a reputable source. In this case, The U.S. Census Bureau was where she started. She went to their web site and searched on “census bureau wage gap” and clicked on the first link in the results. She did not want to focus on news articles; instead she narrowed her search to “publications” and selected the most recent report (see screenshot below).
The data shows us that in 2015, women earned 80% of what men did.
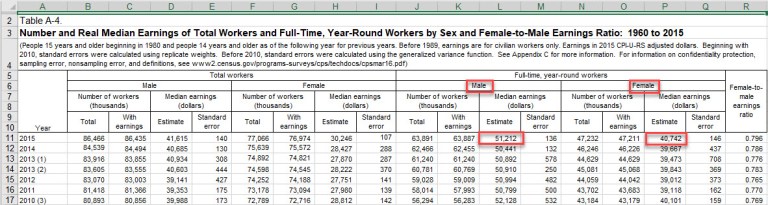
In Table A-4 (see screenshot below) contains the “Female-to-Male Earnings Ratio: 1960 to 2015”. The data shows us that in 2015, women earned 80% of what men did. More specifically, the table shows that men on average earned $51,212 that year while women earned $40,742. If I want to check that “80 cents on the dollar” claim that is so frequently cited, you would need to divide 100 by $51,212 and then multiply by $40,742 to arrive at the percentage. The answer is 79.5555729126. Activists, like Sommers, like to round up – “79.6 cents on the dollar” doesn’t have quite the same ring to it as “80 cents on the dollar.”
Read the small print. The chart, discussed above, shows in the description underneath the chart title, that earnings were used for “full-time, year-round workers who are 15 years and older”. And, in case you were wondering, the Census Bureau explains “a full-time, year-round worker is a person who worked at least 35 hours per week (full time) and at least 50 weeks during the previous calendar year (year round)”.
Just to be clear of what it says, I have included the title and description below to clearly note the guidelines used in creating this data.
Number and Real Median Earnings of Total Workers and Full-Time, Year-Round Workers by Sex and Female-to-Male Earnings Ratio: 1960 to 2015
Number and Real Median Earnings of Total Workers and Full-Time, Year-Round Workers by Sex and Female-to-Male Earnings Ratio: 1960 to 2015 (People 15 years and older beginning in 1980 and people 14 years and older as of the following year for previous years). Before 1989, earnings are for civilian workers only. Earnings in 2015 CPI-U-RS adjusted dollars. Beginning with 2010, standard errors were calculated using replicate weights. Before 2010, standard errors were calculated using the generalized variance function.
Next, Ms. Chalabi searched for “hours worked by gender” and she found that men work more hours than women in a typical work week according to the Bureau of Labor Statistics (BLS). She notes that that is something people are quick to point out but slow to understand.
On average, women spend less time in paid employment because there are only 24 hours in a day and women are more likely than men to spend their time in unpaid work. Things like raising children, taking care of elderly family members and doing housework. What’s more, men are more likely to hold senior positions and work in occupations that pay better (5% of architectural and engineering managers are women, 5% of childcare workers are men). All of these factors are important in understanding why the pay gap exists.
Check the source. One of the simplest ways to do this is to see if other reliable sources come up with a similar number. It turns out they don’t. The BLS claims that women earn 82 cents for every $1 a man makes (as we saw above, the U.S. Census Bureau had this number at 79.6 cents for every $1 a man makes). Again, the small print is crucial here: the BLS are looking at data for 2016, not 2015, and they’re using weekly earnings rather than annual ones. The difference between their figures and the Census Bureau’s isn’t too large to warrant concerns that either is false.
Find out if the statistics accurately reflect all groups. Now we are getting into the socio-economic and demographic arguments made by those who dub the wage gap a “myth”. Well, that BLS page mentioned above already provides some clues.
See, that 80 cents on the dollar statistic varies a whole lot by profession. Last year, female physicians and surgeons earned a paltry 63 cents for every dollar their male counterparts earned, while female cashiers earned 85 cents for every dollar male cashiers made. (If you’re interested in looking up specific occupations, this interactive from the Wall Street Journal is pretty great).
But there’s a lot more to it than that. The gender wage gap also varies depending on where you work, how old you are, your educational status and your race or ethnicity.
The problem is, we can only look at each of those things one at a time. Finding out the wage gap for a black woman with a master’s degree working in engineering in San Francisco is impossible to calculate reliably because survey analysts will only have a few individuals that fit that description to make their estimate. You need a lot of people if you want to avoid making conclusions based on outliers.
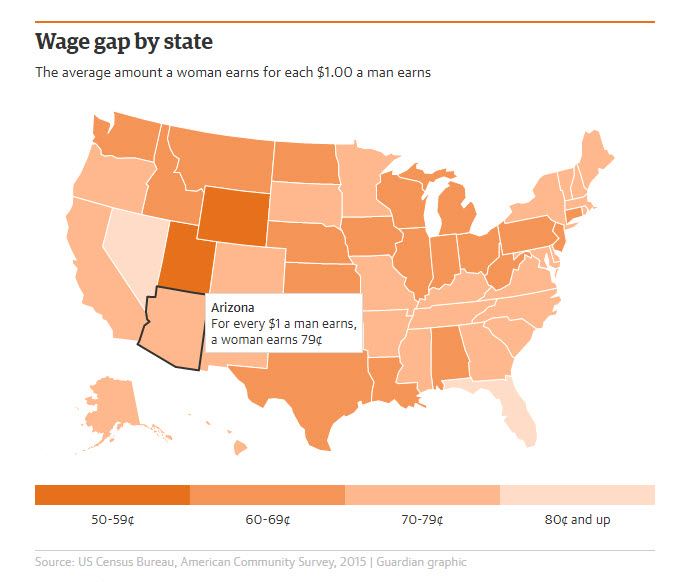
So, Mona, dug deeper and looked at some of these factors one at a time. First up, geography. She used the Census Bureau’s Fact Finder site to get these numbers (warning: the site is a real pain in the butt – you have to search by selecting “sex” and “Income/Earnings – Individuals” and then pick the table you need). She found that the wage gap varies a lot across the country. Women in Utah earn 55 cents for every $1 that men in the state earn – in DC that figure is 86 cents, behind Puerto Rico, the only state or territory in the country where women actually out-earn men by two cents on the dollar.
And the Fact Finder site has data on race too. This is where you can really use statistics to tell whichever story you choose. See, you could compare within a race (Hispanic women earned 91 cents for every $1 earned by Hispanic men in 2015) or you could compare between race and gender (Hispanic women earned 54 cents for every $1 a white man earned that year).
So that 80 cents on the dollar figure is misleadingly simplistic. For women of color, women in the Midwest and those working in certain occupations, the gap is much larger than that.
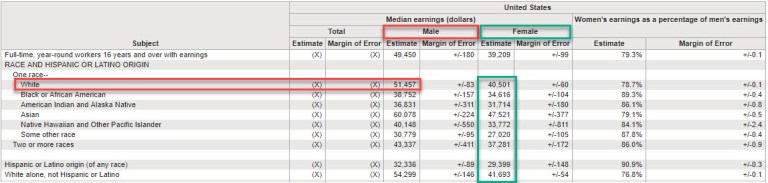
In the screenshot below, I show what a White male earns compared to women of color and race. Black women earn a medium income of $34,616 compared to the medium income for a white male of $51,457. What this tells us is that a Black women earns 67.3 cents on the dollar compared to a White male.
I hope you found Mona’s fact checking and her methodology helpful. I know I did. It is hard to believe that in 2017, income equality still exists and activists like Christina Hoff Sommers still continue to try to sweep this issue under the rug.
If you would like to contact Mona directly to discuss her article in more detail, she can be reached at mona.chalabi@theguardian.com / @MonaChalabi.
Best Regards,
Michael
Source: Chalabi, Mona, Equal Pay Day: a Wage Gap Fact Check, The Guardian, April 4, 2017, https://www.theguardian.com/us-news/datablog/2017/apr/04/equal-pay-day-us-wage-gap-gender-race-ethnicity.
