
Readers:
In Part 2 of my review of the MOOC, Data Exploration and Storytelling: Finding Stories in Data with Exploratory Analysis and Visualization, I reviewed two stories Professor Cairo presented regarding the importance of data visualization and how data encoding makes data easier to understand.
 In Part 3 of this review, I am going to share some of the content that was taught in the third video of Module 1. This video was presented by Heather Krause (photo, right).
Again, I hope you find this MOOC series review helpful and I highly encourage you to take courses not only from them, but other offerings in the MOOC space.
Best Regards,
Michael
Module 1 – Finding and Understanding Data
Finding Data
In this third video for Module 1, Heather provides us an in-depth review of some best practices for finding data. She points out that finding data is a lot easier than it used to be, thanks to the internet. Also, there are increasing amounts of open data sources to help us strongly embrace the ideas of transparency and accountability in research and data. Because of that, many non-academic organizations and individuals have access to all kinds of really interesting data.
So, where do we find the data? The most obvious place to start is Google. If you have
a topic and you enter the topic into Google and end with the word “data”, and there you go. You have some results. Heather used an example of refugee data, which she uses as a theme throughout many of the videos. She was doing quite a lot of work, at the time of recording the video, on how to understand, support and put in place policies for refugee
resettlement using data. So data science for refugee resettlement is one of the projects she was doing a lot of work on.
Finding Excel Spreadsheets with Google
So if we Google “Refugee Data”, the screenshot below shows us what we get.

Heather then showed us how, if we make a few small changes to our Google
search, we can be specific in our search for “Refugee Data’ to only return results with the file type .xls, so we can focus only on Excel spreadsheets related to refugee data.

As you can see in the screenshot above, Google immediately ignores everything that is not an Excel spreadsheet. An Excel spreadsheet is usually a very good place to start because a large amount of data can be stored in the spreadsheet.
Other extensions or file types you can try are .csv or .xlsx.
So, if we go to the file type .xls Google results (see screenshot below), we see
the State of Virginia is collecting data on refugees. Heather pointed out that this is very interesting and did not come up when we searched without file type (she also pointed out that it probably came up in the results, but it would have been hundreds and hundreds of pages back).
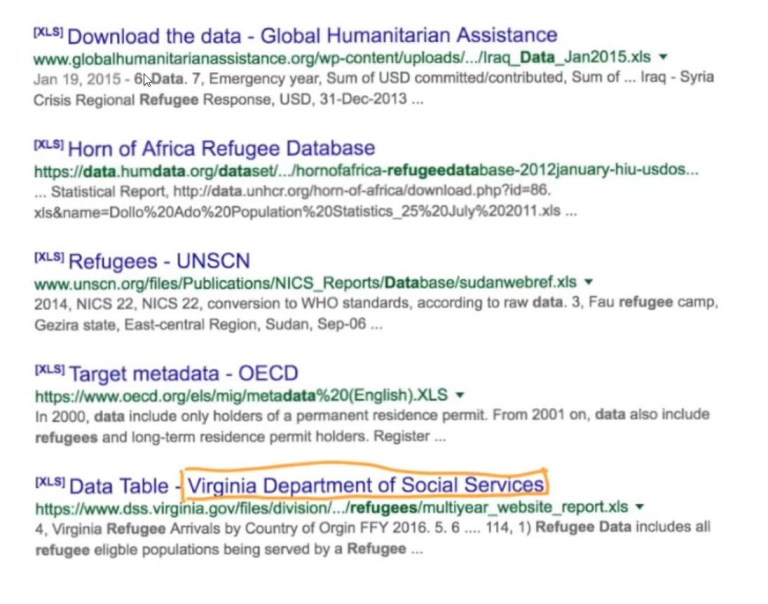
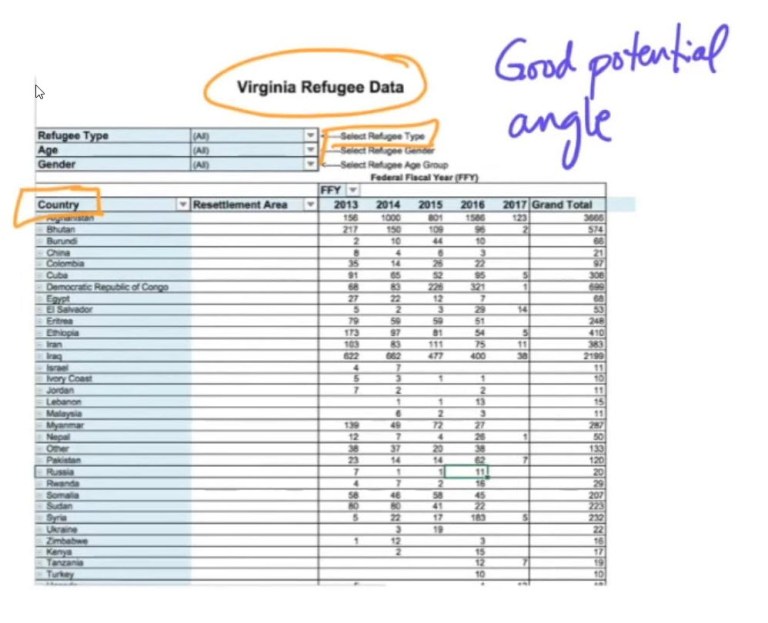
Reviewing the screenshot below, we can see that we now have a very interesting piece of data on refugees. It looks like the State of Virginia is keeping very careful public data on refugees where they settle in Virginia and where they came from and also even what type of refugees they are.
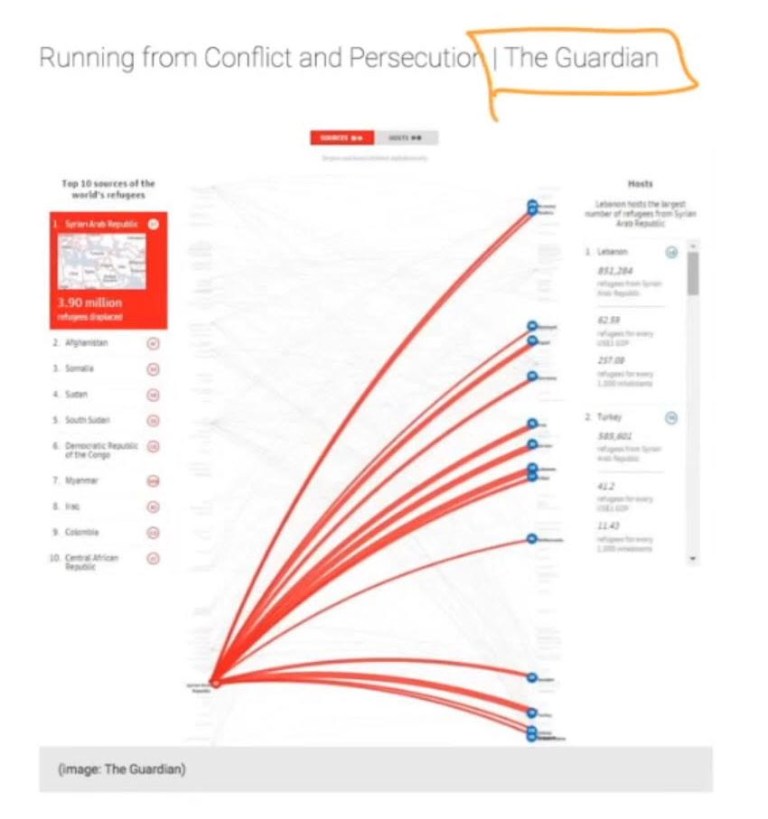
A story angle to thing about is if we can we show the flow of refugees by State? That would be a very interesting data journalism piece.
On the next page of the Google search (see screenshot below), we see a topic for protection incident monitoring inventory.
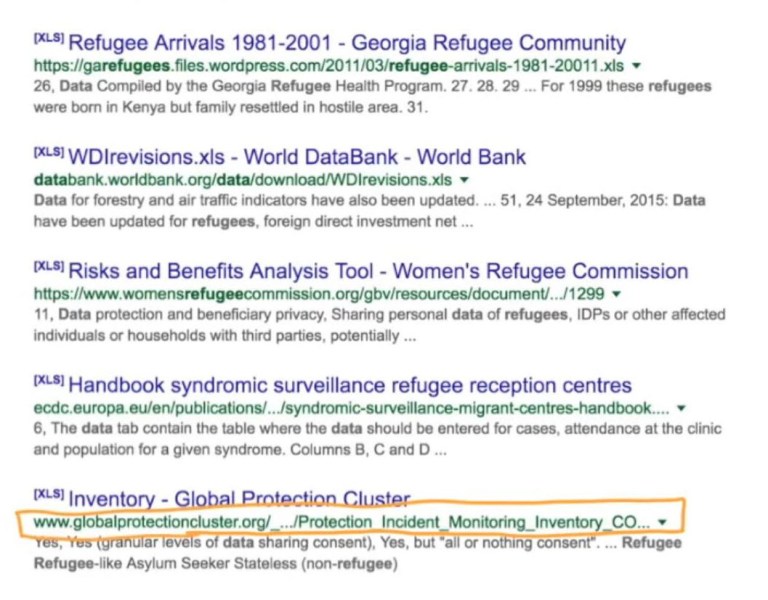
We are not sure what this is, so we click on the link to review the data. It looks very interesting (see screenshot below).
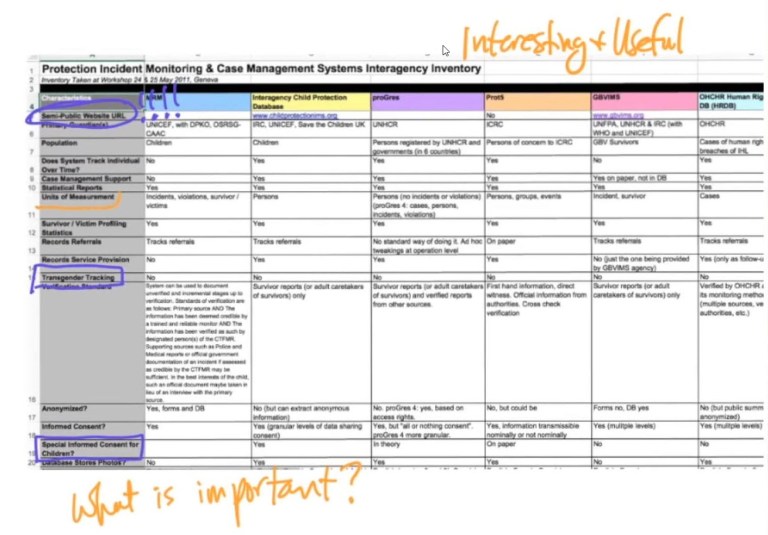
Heather points out,
One of the useful things about pieces of documents like this, is that it tells you what other people are tracking. It tells you what data points, indicators and variables that are important to people working on the ground in your story area. In this case, here we have a semi-public website. That’s very interesting. Semi-public is very interesting. It might be a good source or a good lead, something unusual. Children, there is an interesting topic that you might want to consider if you are going to work on refugees. And transgender, that’s also very interesting. So you can see how finding data really does contribute to the iterative process. Simply the act of looking for data will help you form possible angles for stories building a foundation of understanding of your topic. This is a very important process. This data here has a lot of metadata, and we will be talking about metadata very soon. Metadata is data about your data, information about your data. So that’s very important. [1]
Unusual Sources in a Google Search
Now if we use the .csv file type, we see that again we get the data to show up much more quickly. Often time, data from sources you might not ever see (see screenshot below).
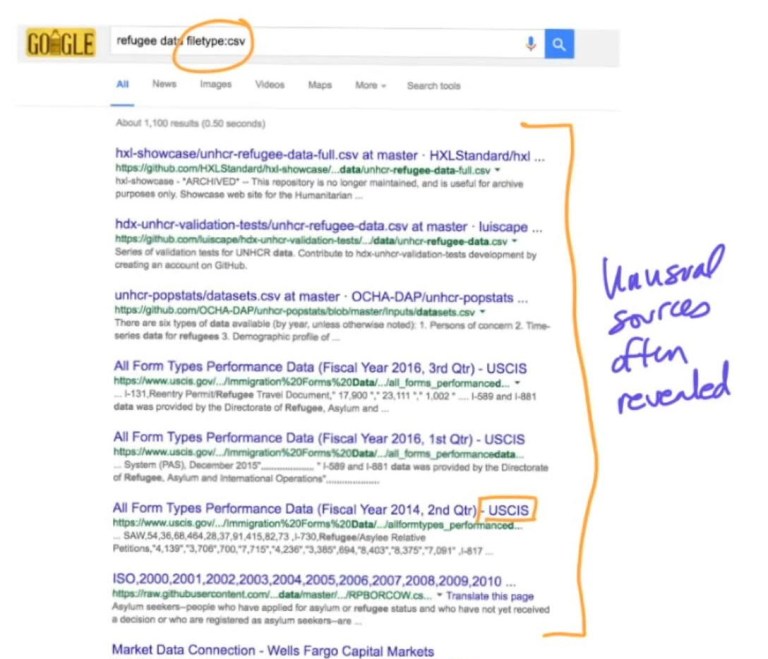
Heather told us a story where she had very interesting data come up from things like school board meetings, where everything is public but it is not really published. It certainly isn’t published in a way that is easy to find. So searching by file type is very useful.
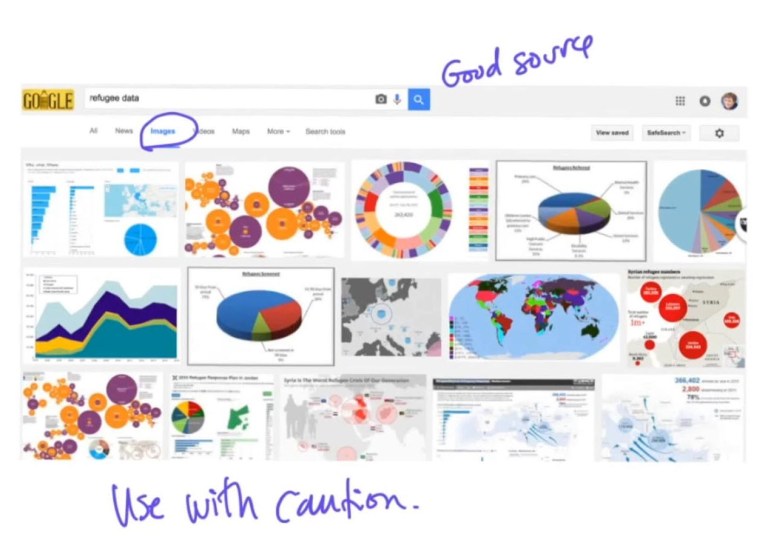
Images in a Google Search
Heather pointed out that another very useful trick is searching in images.
Heather noted,
This seems counterintuitive. You want data. But one of the very important aspects of data/data journalism, as our colleague Alberto Cairo knows quite well, is visualization and its very important right now.
By searching in the images section for refugee data we will probably find people working on data with refugees and analyzing it in interesting ways. This doesn’t mean you should take all of this to be truth. There are a lot of bad visualizations and poorly done visualizations. However, it can be very helpful if you are extremely careful.
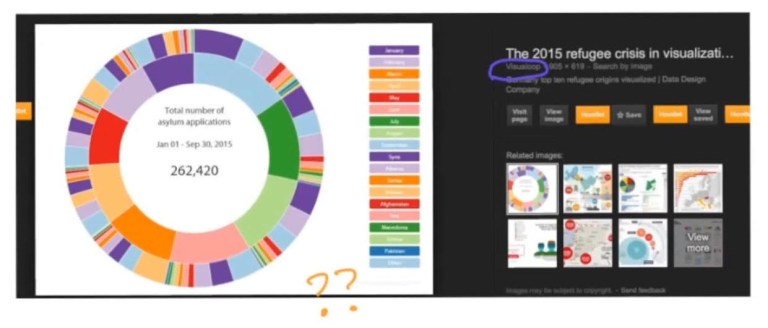
The screenshot above is the visualoop website, which is doing something really interesting with refugee data. We can’t really understand what they are doing from here. But if we follow the link, we end up with very interesting sources that are using data about refugees to answer questions.
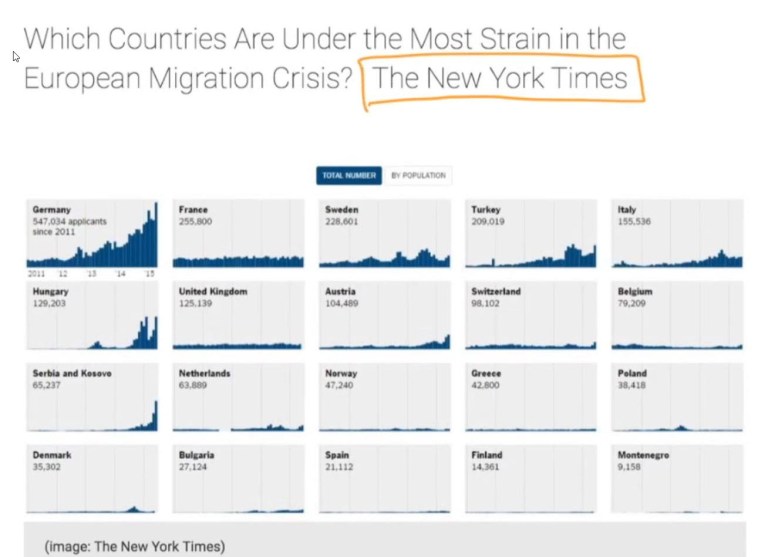
Below are images from some very popular publications such as The New York Times. Also, less known publications also have images that are not in English. So this could be a very good lead of where to find unusual and important data that you might not otherwise find any where else.
Data Repositories
After Google search, the next obvious place to look is data repositories. Some data
repositories are indexed by Google, which means their results will show up in your Google searches, but many data repositories are not indexed by Google, which means they won’t show up.
Heather pointed out that, as part of the MOOC course material, they have provided a list of many different data repositories that they know about. She also pointed out that one of the great things about a MOOC is that you can make your own contributions so we can all learn from each other to find new data sources.
Here are a couple of examples.
NICAR data library contains a database that has some very interesting data in it. You will want to note that some of this data in this data repository is free, some of it you pay for.

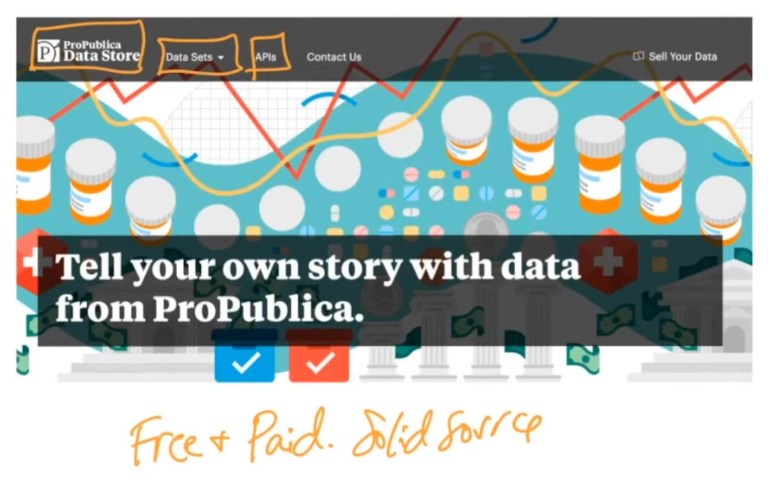
The is also true of ProPublica. They have an outstandingly good data store. It’s not very big, but the data is very, very good quality. It can answer some very interesting questions. Again, some of that data is free and some of that data you will need to pay for.
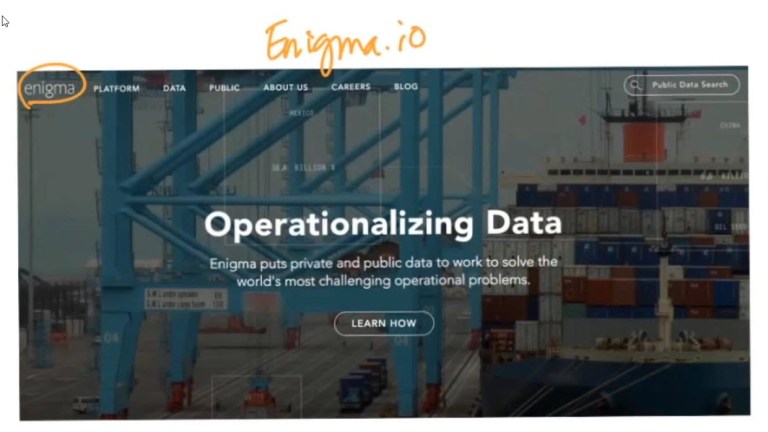
Here is Enigma, which catalogs a lot of publically available data in interesting ways. If we use this for some refugee data we will find Al Qaeda and Texas budgets. These are pieces of data that you would find searching through a 100 pages of Google, but this makes it easier and also gives you some ideas of angles you might be able to take with data that you haven’t thought of before.
Open data is a very important source, although, it is usually not the best source. The data is okay, but the data they make available to the public often won’t answer the questions that you need. Feel free to Google anything you want (e.g., “Open Data”) and you will get it all there.
There is also a project called the Dataverse, which was developed at Harvard. But many similar ones exist throughout the world today. Within the Dataverse, researchers and academics, anyone who is collecting their own data is uploading their data to these Dataverse’s.
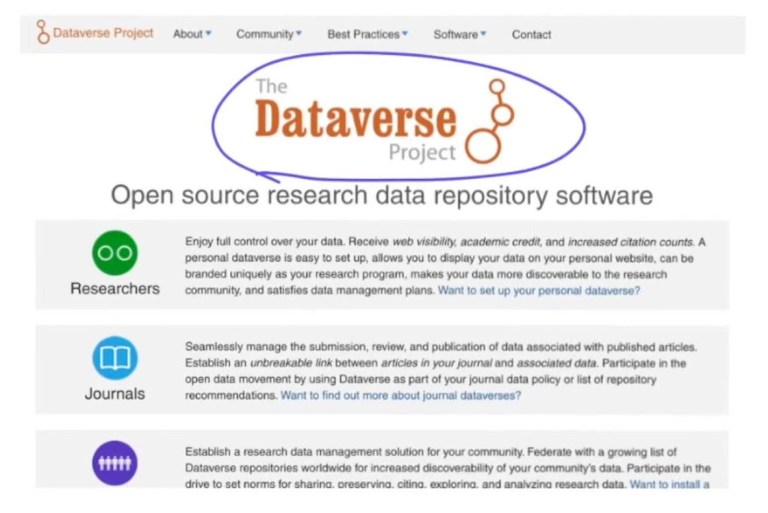
Heather stressed that transparency and reproducibility in research has become a very important part of our modern research process. So in order to facilitate that, researchers who use data to do research have to make their data available so you can check to see if their results are real. And it also allows others to use that data as a source for other stories.
Finding Data Sources in a PDF Report
After you have exhausted all of the data sources mentioned above, there are a few other ways to get data. One of them is reading reports really carefully. When you have, usually a PDF report, from an organization that is studying or advocating on your topic.
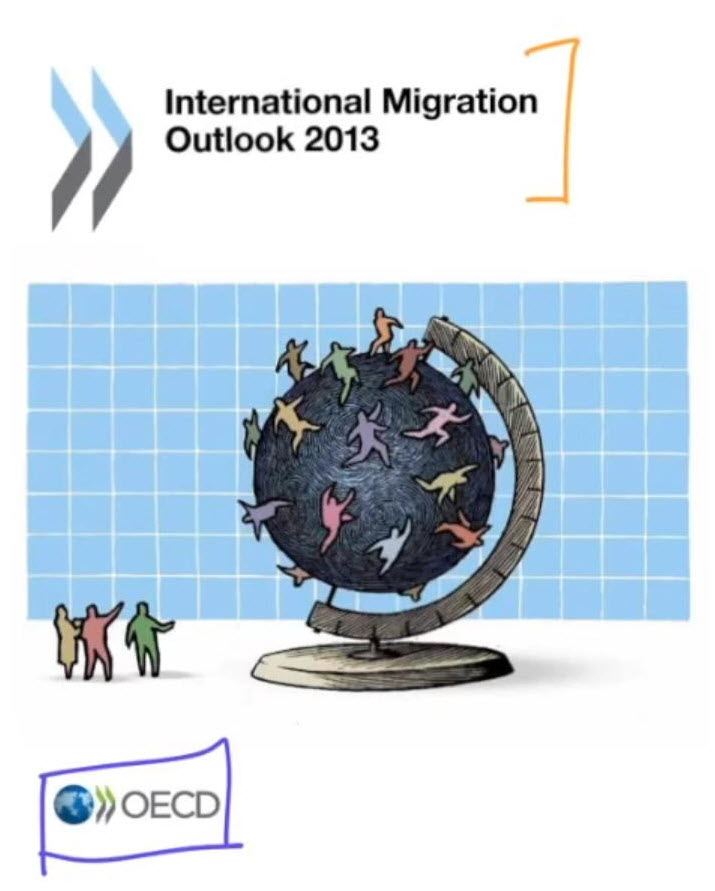
Heather’s example is refugees. If you read these reports really carefully there are usually little tiny links to the data. So below is an example of the OECD migration report. If you look way down here, you will see an example of the link.
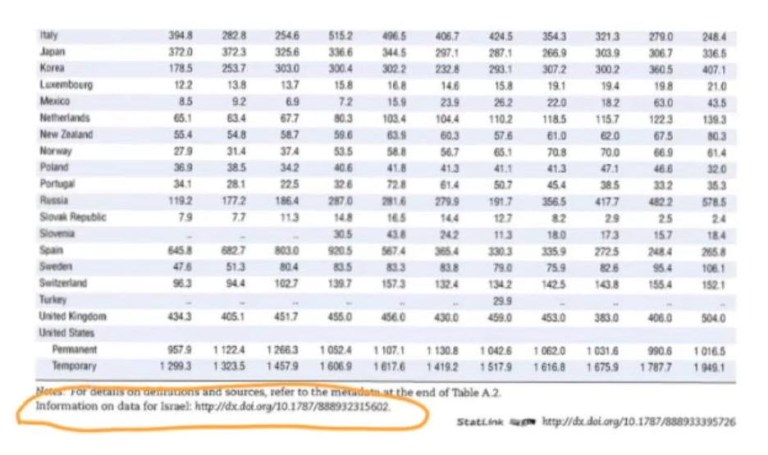
If you click the OECD link shown above, you’ll get an Excel spreadsheet (see screenshot below) and that Excel spreadsheet will have all the data that is behind the report. That won’t have the microdata, but it will have summarized tables.
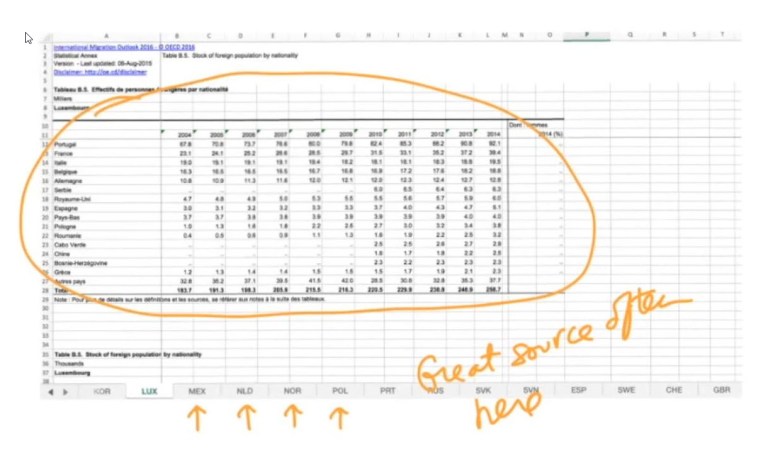
Often times there are workbook tabs in the Excel spreadsheet (see screenshot below) and these are tables that are not included in this PDF. It is sort of behind the scenes analysis that they did, but may be too complicated to report on. Heather notes that these are gold in terms of data journalism.
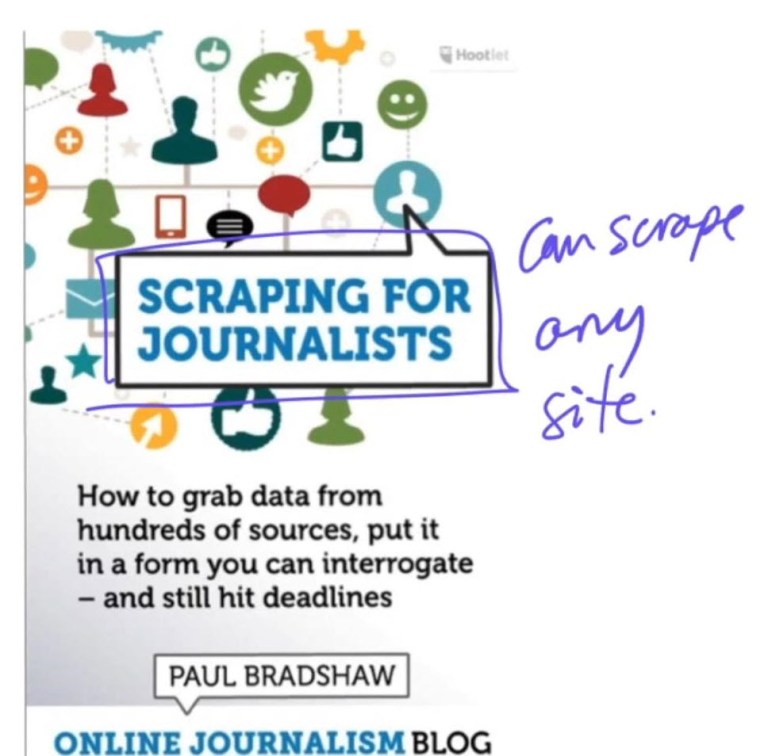
Scraping Data
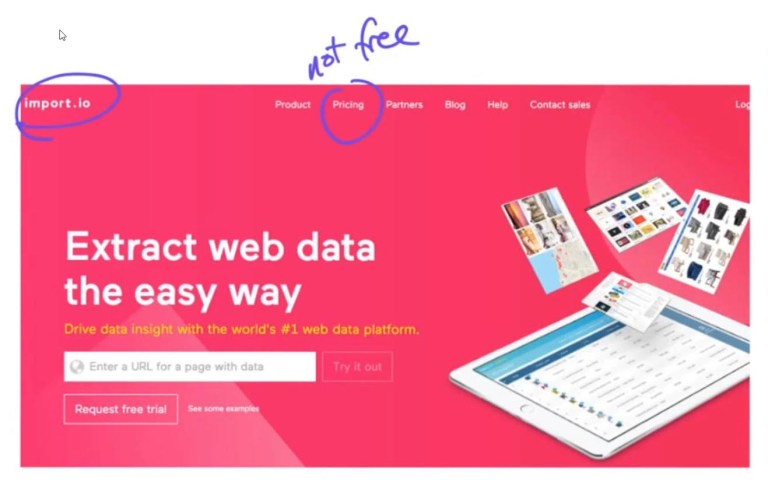
If you really can’t find your data anywhere, then you can scrape it. There are a couple of different ways to scrape it. Heather recommended the website Import.io (see screenshot below) that she uses a lot. She feels that it is very logical and a quick and intuitive way to work with data. You need to practice for a while then you can get data off of any website that has data. Or if you want to learn how to code or hire someone to code, you can scrape data from almost any website that has data.
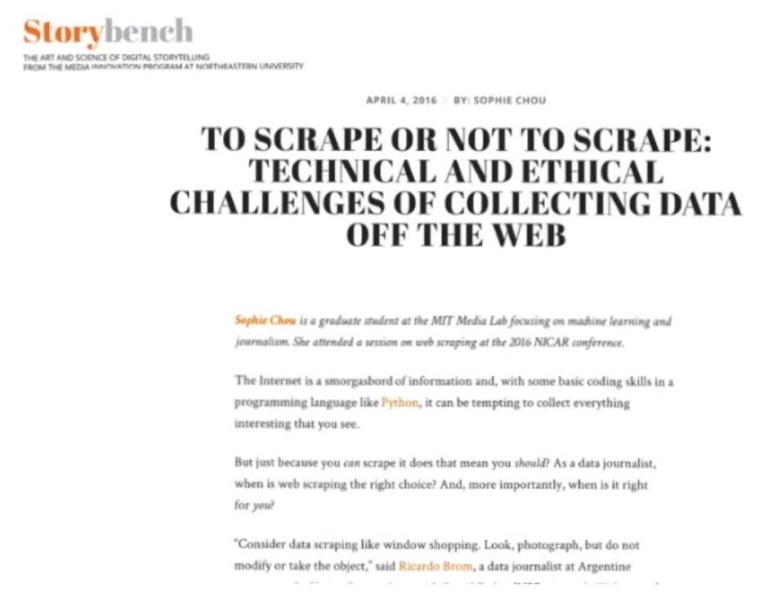
If you are going to scrape data or use data that is a little hard to find, it is a very good idea to consider the ethics of scraping data.
Heather notes,
There is no single consensus on what the ethics are at using data that is semi-public on that link or is scraped. Many people say, if it is on the internet than it is public then it is usable. That’s fine, but that’s not legally written in anybody’s code of ethics that I’m aware of. I think there are many different perspectives on what data is free to use and what data isn’t. It is very important to read the user terms and conditions on any website where you are scraping data or any report you are taking data from.

Heather also points out,
It is also important to look at the robots.text file (see example screenshot below). This is only if you are going to scrape data you need to look at the robot.txt file at the root of the website, which will basically tell you the parts of the website you are and are not allowed to scrape.

And there is a very, very good article (Click on screenshot below to redirect to the article)on the conversation about the ethics of scraping data. If you are using data that is in a report or is easily downloadable in an Excel spreadsheet from someone’s website you are on very solid ethical grounds.
Bottom Line: If you are scraping websites, you might want to take some time to think about what you’re doing and who it could expose and the consequences of that.
Summary
Part 3 of this series has shown you many different ways to find data: Google searches, special Google searches, reports and scraping data. In Part 4, we will discuss the scenario where you now have the data you need, how do you understand that data before you start working with it.
Next Blog Post: Continuation of the Review of Module 1 – Understanding Data
Sources:
[1] Alberto Cairo and Heather Krause, Course Video: Module 1: Visualization for Discovery, Data Exploration and Storytelling: Finding Stories in Data with Exploratory Analysis and Visualization, Knight Center for Journalism in the Americas, The University of Texas – Austin, January 16–February 26, 2017.
