
Otto Neurath and the Origins of ISOTYPE
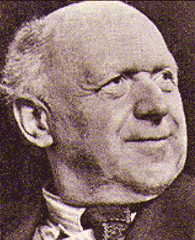 A visual program for displaying facts and quantitative information, the ISOTYPE system was born from research and theories of Otto Neurath (1882–1945), a Viennese philosopher, economist and social scientist. As a child he was fascinated by the function of Egyptian hieroglyphics—their forms and ability to communicate a story. This early influence was integrated into his life’s work, the development of a system to pictorially organize statistics.
During the 1920’s Neurath was a leading figure in a circle of Viennese intellectuals known as the Logical Positivists. In 1929 he helped author the group’s manifesto, The Scientific Conception of the World, The Vienna Circle.
The Positivists declared that philosophies founded in religion, metaphysics and ethics were merely expressions of feelings or desires and therefore lacked any cognitive sense. They asserted that true meaning could only be found in mathematics, logic, and natural sciences.
In 1925 Neurath, while head of a housing museum, initiated The Social and Economic Museum of Vienna. The museum’s purpose was to educate the general public about post-war housing by creating displays of social information. The new venue afforded him an opportunity to showcase his intellectual and educational ideals using his symbol-based language — an alternative to written language.
By the early 1930’s Neurath headed a team of 25 employees divided into four groups;
- Data Collectors: Comprised of historians, statisticians and economists.
- Transformers: Visual editors and liaisons between the data collectors and the graphic artists.*
- Graphic Artists: Illustrators who drew the symbols and artwork.
- Technical Assistants: Assisted in paste-up, coloring and photography.
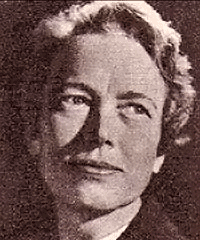
Marie Reidemeister Neurath, Transformer*
While working at the museum Neurath began his collaboration with Marie Reidemeister, who would later become his wife. Reidemeister was educated as a physicist, mathematician and also had attended art school. She and fellow senior transformer* Friedrich Bauermeister, organized the information into comprehensible formats, in a role that would be described today as a graphic designer.
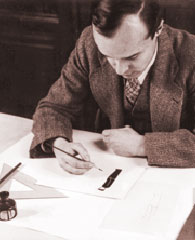 Gerd Arntz (1901–1988) ISOTYPE Illustrator
An essential member of the Neurath group was German artist Gerd Arntz who joined the ISOTYPE team in 1928. Well educated and from a comfortable background, Arntz became an activist who embraced the same socialist ideals as Neurath. Artistically he was influenced by the Expressionist and Constructivist movements, expressing his socialist values through primitive wood block printing.
Motive for ISOTYPE
Visual education was always the prime motive behind ISOTYPE. It was not intended to replace verbal language, rather it was a “helping language” accompanied by verbal elements. Neurath was deeply convinced that his “world language without words” would not only enhance education but facilitate international understanding.
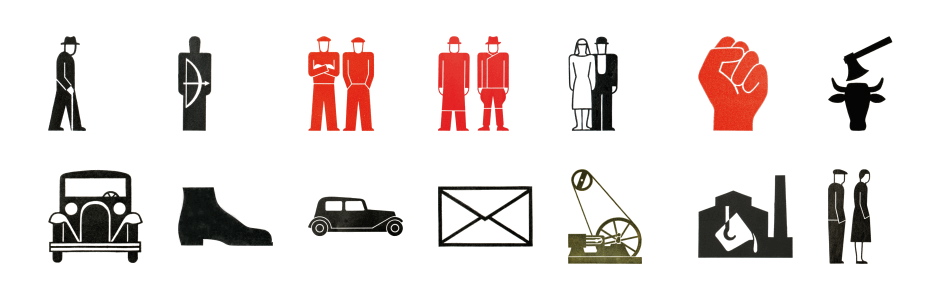
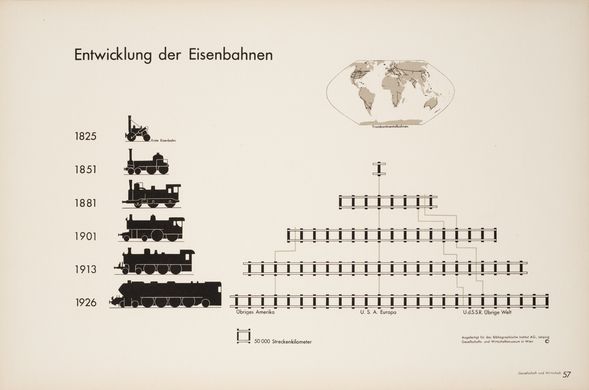
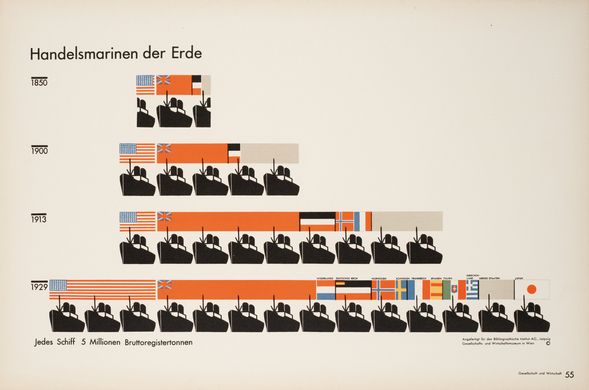
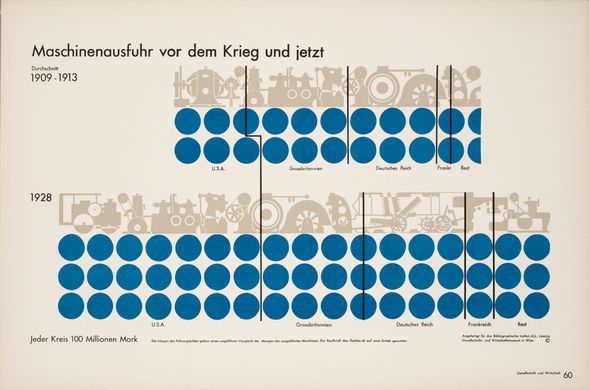
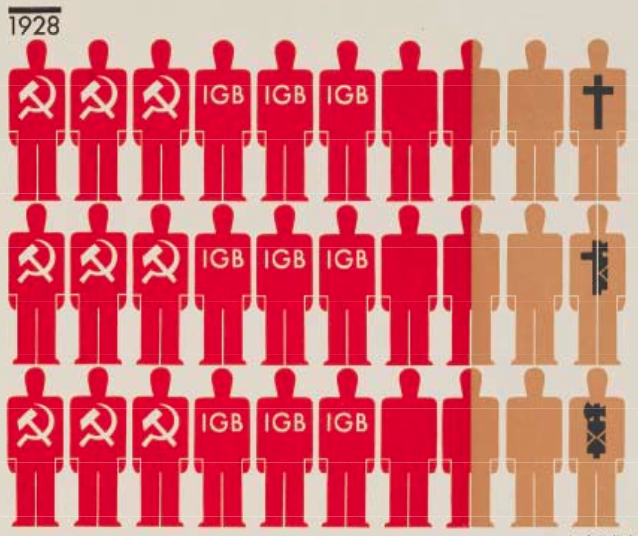
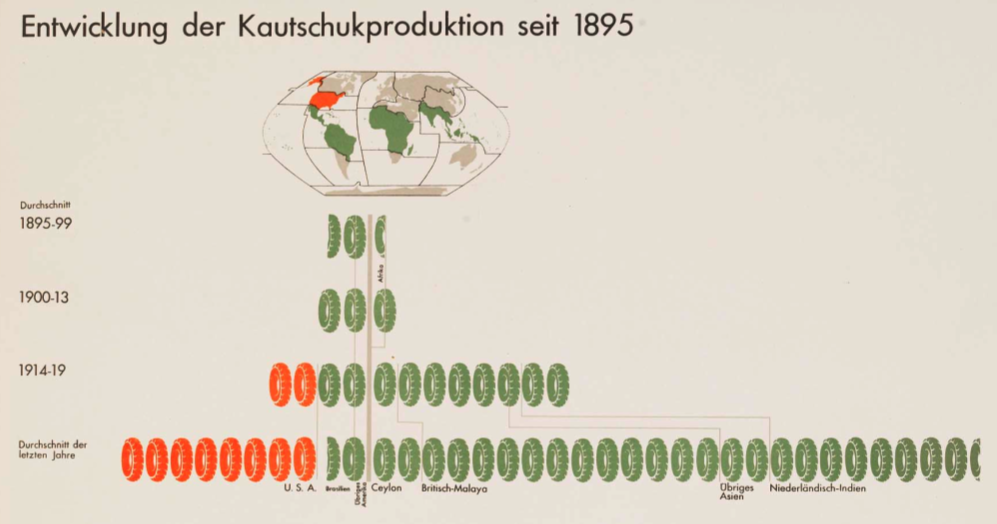
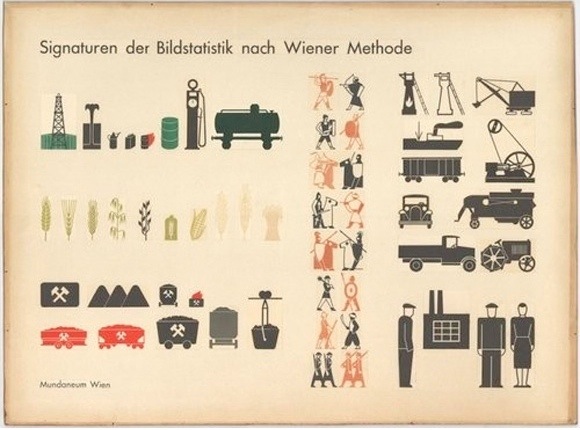
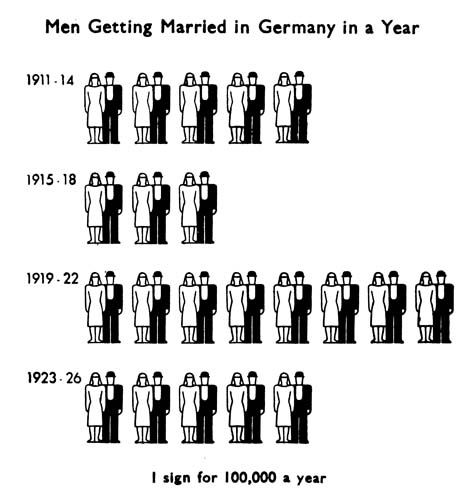
Neurath rejected histograms with numerical scales, pie charts and continuous line charts for a method that displayed facts in a more easily understood form, numbers were represented by a series of identical pictorial elements or signs, each of them representing a defined quantity. While his contemporaries showed variation by altering the size of their symbols, Neurath increased or reduced the quantity of symbols, each symbol representing a specific amount. Neurath called these “amount pictures” or “number pictures.”
Neurath’s writing and imagery reflected the cultural blind spot of his era. Would Neurath’s ISOTYPE symbols today be questioned for stereotyping / assumptions about women, family and race?
“A specially important part in the ISOTYPE system as it is presently used is taken by the pictures giving ‘statistics’ or the relation between amounts of different things— amount pictures or ‘number fact pictures’ To most men the reading of long lines of numbers is a great trouble— they put down a book when they see if has in it numbers or curves. But pictures are an attraction. This fact gives the ISOTYPE system a special value for all sorts of education.
It is not necessary for every reader of ISOTYPE pictures to have a complete knowledge of all the rules of the ISOTYPE system, because without being conscious of the reason he gets the effect of the pictures. It is the same with the reading of a good play or are well-balanced bit of writing. there is not need to have a knowledge of the art used in producing such effects to get pleasure from it. We may even say that almost no knowledge at all is necessary of the ‘words’ of the picture language—the signs—or of the rules for talking this language—the system.”
The Transformer
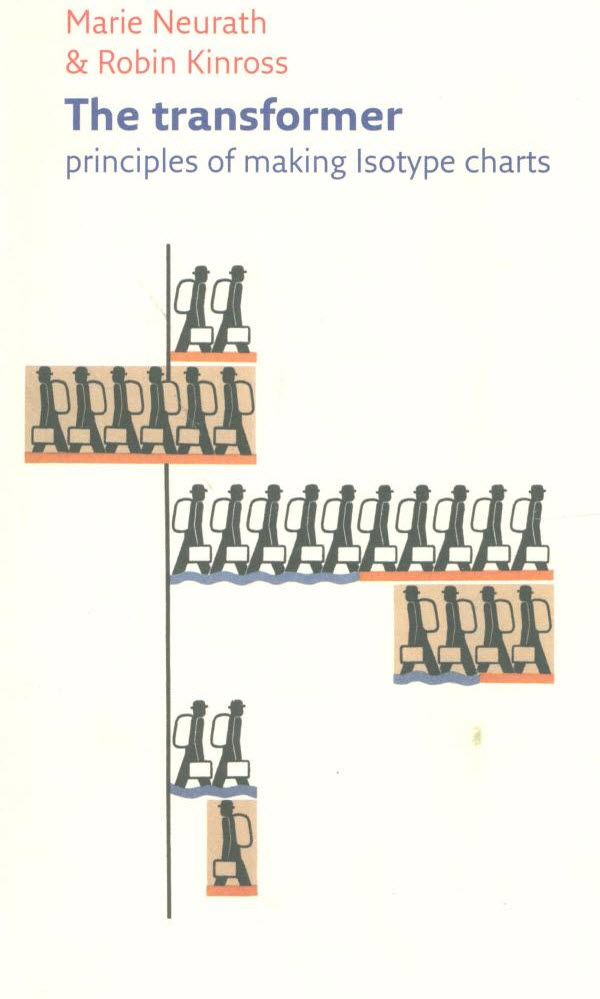 The Transformer: Principles of Making Isotype Charts is the first English-language volume to capture the story of Isotype, an essential foundation for our modern visual language dominated by pictograms in everything from bathroom signage to computer interfaces to GOOD’s acclaimed Transparencies. [1]
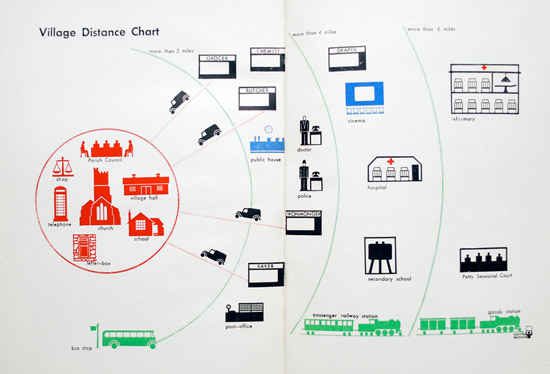
Examples of ISOTYPE Charts

—————————————————————————————
References
[1] Popova, Maria, Vintage Visual Language: The Story of Isotype, brainpickings.org, March 8, 2011, http://www.brainpickings.org/index.php/2011/03/08/the-transformer-isotype/.
[2] –, Vintage InfoPorn No.1, informationisbeautiful.net, March 7, 2011, http://www.informationisbeautiful.net/2011/vintage-infoporn-no-1/.
[3] –, TEAM ISOTYPE : Otto Neurath, Marie Neurath and Gerd Arntz, Graphic Design History, http://www.designhistory.org/Symbols_pages/isotype.html.
[4] –, Images: Otto & Marie Neurath Isotype Collection, University of Reading.

4 thoughts on “DataViz History: ISOTYPE Charts: The Vintage Visual Language That Gave Rise to Modern Infographics”