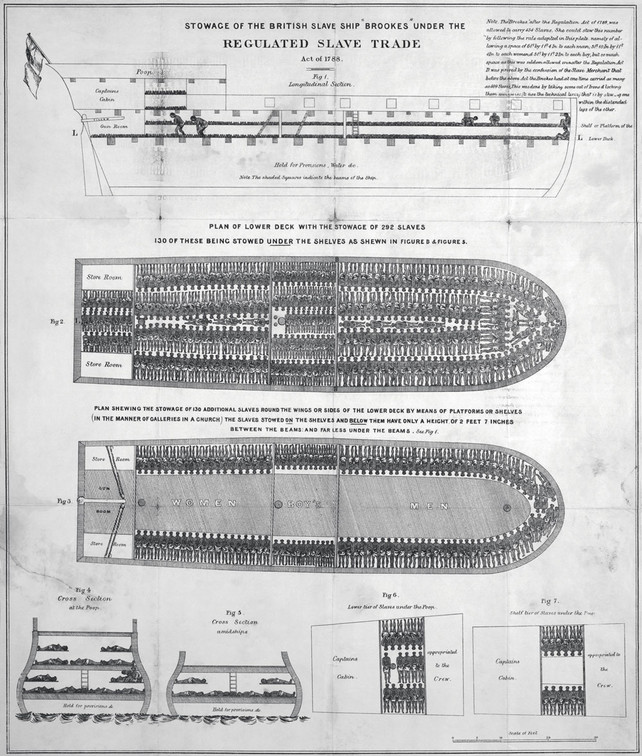
In 1789, 7,000 copies of the print of the slave ship ‘Brookes’ were printed by the Quaker printer James Phillips. Showing sections of the ship and the inhumane way in which slaves were stowed, this drawing and variations on it became one of the most iconic and shocking images of the movement.
The diagram above, which visualizes an overcrowded slave ship, was an early example of graphic design that has the power of words. [SOURCE]
If you had to compile a list of the most important infographics in the history of western civilization, this cutaway chart of the 18th-century Brooks slave ship would rank right up there with Charles Minard’s flow map of the ill-fated Russian campaign of 1812 and pretty much anything by Ed Tufte.
Eye magazine has a fascinating account of how the drawing became a key visual weapon in the 18th- and 19th-century fight against slavery, as part of a larger feature on information design that changes minds. First published by British abolitionists in 1788, the diagram depicts a vessel of 400 slaves packed in cheek by jowl, some with just 2 feet and 7 inches of headroom. The Brookes was an actual ship that schlepped enslaved Africans to Liverpool, England, and typified the slave vessels of the era: The Regulated Slave Trade Act of 1788, which was designed to reduce deaths due to overcrowding on slave ships, allowed each man 6 feet by 1 foot 4 inches of space (women and children were granted slightly less room). By those measurements, the Brookes was able to carry up to 454 slaves. The diagram’s engraver could only squeeze in 400.
In the years that followed, the Brookes slave ship drawing was republished in broadsheets, and as a poster, all over Britain, France, and the United States, and came to symbolize everything inhumane about the slave trade. Whether it swayed public opinion or simply articulated the sentiments of the already converted is, of course, impossible to know. (The U.K. didn’t abolish slavery until 1833.) But the economy of the image, and the “intelligible and irresistible” way it conveyed information, as the abolitionist Thomas Clarkson said, made it an unusually resonant form of anti-slavery propaganda. It was design with the power of language.
Eighteenth-century abolitionists used every propaganda tool in the book, but one of their most widely circulated visual aids was an innovative diagram of the Liverpool slave ship Brookes (above), first published in 1788.
Thanks to a parliamentary survey that year, detailed measurements of the Brookes were available and a group of Plymouth-based campaigners had accurate deck plans, cross-sections and side views drawn up. Into these were added hundreds of prone black figures, not dissimilar to Isotype figures (Otto Neurath had a German reproduction of the diagram, dated around 1800, in his private collection), drawn to the dimensions laid down in the Regulated Slave Trade Act of 1788 (‘6ft by 1ft 4in to each man, 5ft 10in by 1ft 4in to each woman, 5ft by 1 ft 2in to each boy, 4ft 6in by 1ft for a girl’).
Under the act, which was designed to reduce the overcrowding that led to so many deaths on the transatlantic crossing, the Brookes was permitted to carry a maximum of 454 slaves. The engraver managed to fit 400 in. At least one earlier voyage had carried a human cargo of 609 African people.
London abolitionists had it printed on 7000 posters (in one run), and, in the years that followed, the diagram was widely copied in broadsheets, pamphlets and books in Britain, France and America. ‘No one saw it but he was impressed,’ wrote the tireless abolitionist Thomas Clarkson, who was partly responsible for the original. ‘It spoke to him in a language which was at once intelligible and irresistible.’ Art critic Tom Lubbock described it as ‘perhaps the most politically influential picture ever made’.
Despite its undoubted power – the diagram moved people to tears as early as 1789 – Wilberforce’s act abolishing ‘the purchase, sale, barter or transfer of persons intended to be … used as slaves’ throughout the British empire was not passed until 1807. Slavery itself was not banned until 1833.
Image: Library of Congress / Science Photo Library.
First published in Eye no. 82 vol. 20.


Reblogged this on mag the historian and commented:
The Maaffa
Cool