I have always liked New Orleans. I don’t think there is any city like it anywhere else in the World. It hums and sings all night and day. The food is great and the people are a unique brand all their own.
I was sadden when Katrina almost wiped out the city. I have been rooting for its full recovery and for people to return to it. I love the HBO show Treme and how it depicts life right after Katrina.
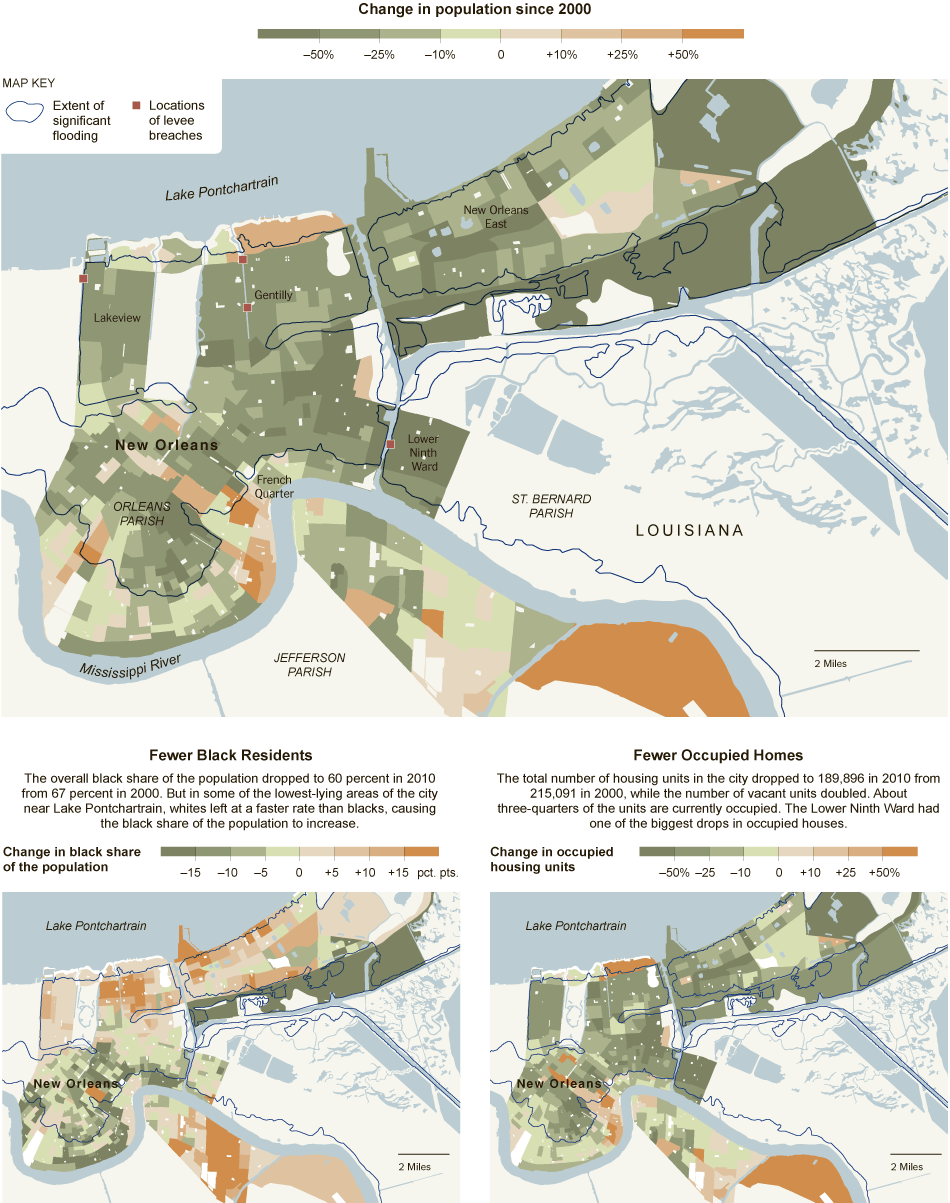
I am currently in Alberto Cairo’s MOOC class, Introduction to Infographics and Data Visualization. Each week, Dr. Cairo recommends sites we should go to to see great data visualizations and infographics. This week, I went out the The New York Times Infographics site (Small labs, Inc.). I found this infographics about the population decline in New Orleans.
The overall population of New Orleans has decreased by 29 percent since a decade ago, according to data released by the Census Bureau on Thursday, January 31, 2013. The Lower Ninth Ward, the poorest neighborhood in the city and the one hardest hit by the storm, had the largest population decrease. Pockets of New Orleans East, a low-lying section of the city that was also devastated by the storm, also had large drops. The few areas with an increase in population tended to be along the Mississippi River, a higher-elevation section of the city that was not significantly flooded after the storm. [Source]
This is very sad news to hear. I hope through people visiting for Marti Gras, sports events, and other occasions will find it the right place for them to be and help bring the city back to a full recovery.
Regards,
Michael