
Yuli Wang Bio
Hi, this is Yuli from China. First of all, thanks to Michael for letting me be on his blog. I was born and grew up in Shaoxin, Zhejiang, located in Eastern China. My major is Geographic Information Science in college and my first job is a GIS Data Engineer in the field of intelligent transportation. After my resignation, I went to New Zealand for working holiday and stayed there for 456 days. It is an extremely special and unforgettable experience for me. Now I work in a commercial real estate company as a data analyst to start a whole new journey.
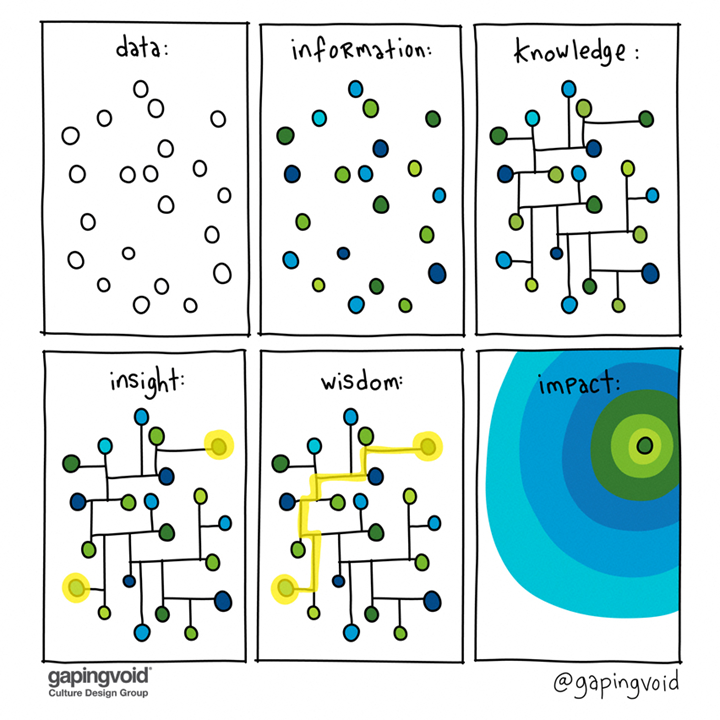
At the year of 2019 Tableau came into my life and I just fell in love with it. Gradually Tableau became a tool for me to explore the world and express my thoughts. And I soon began to output some work. I really hope that I can create more visualizations, to distil the data, information, and knowledge into beautiful, useful graphics and diagrams and make them into impactful, just as the following picture shows.
QUESTIONS

Michael: Hello, Yuli. I really liked your dataviz, Every Vote Counts——The American Presidential Election. Can you talk about the process you followed to collect the data, analyze it, design, and then build the dataviz in Tableau?
Yuli:
About Tableau Monthly Viz Challenge
Here in China, Tableau officials organize a visualization challenge with a selected topic every month, and the data set related to the topic will be provided for participants. The theme of this month is about the US presidential election. The data set is as follows, including year, state, county, candidate, party, number of votes, etc.

Learn more about the United States Election
I know this year the US presidential election has just ended. The election has been a real hot topic on Internet in China because of its even result. But, to be honest, I am not a person concerned much about politics. Before this, I only care about who would be the elected president at the end. I have no idea about the rules of the US presidential election. So at the beginning I thought it would be like who gets the most votes and who wins. Obviously it didn’t end up this way.
Then, I learned that the President of the United States is elected by the electoral college, not directly by the voters. And there has been five times in the history of the United States when candidates lost the national popular vote but won the election, the most recent one happened four years ago.
Then, I collected some information and data about United States Electoral College and Electoral Votes from Wikipedia, as the table shown below, the number of presidential electors by state and year.
After simple data collection, transposition and table association, my data processing is completed.

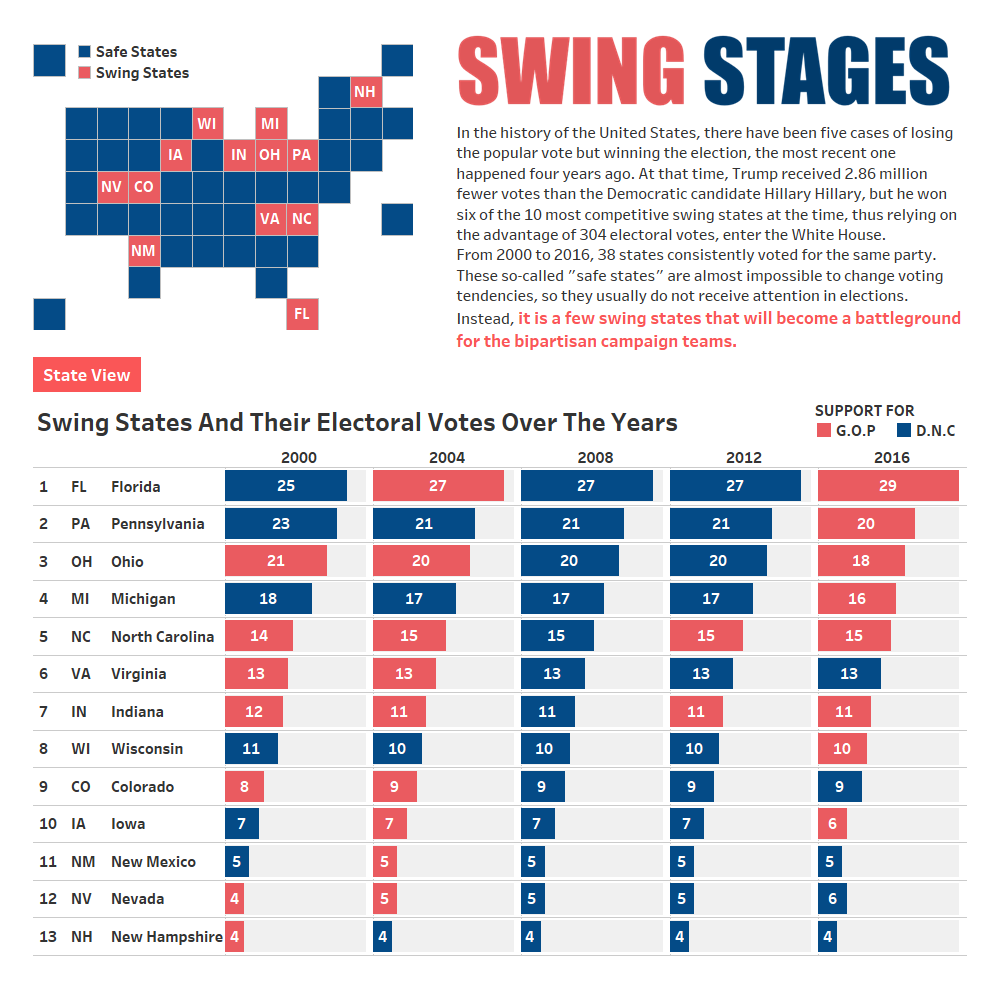
About the swing states
I also learned that based on the unique electoral system, the US presidential election results often depend on the votes of several key swing states. The number of swings is different on every election, and the swings in the minds of major media and civilian institutions also have differences.
Start visualization
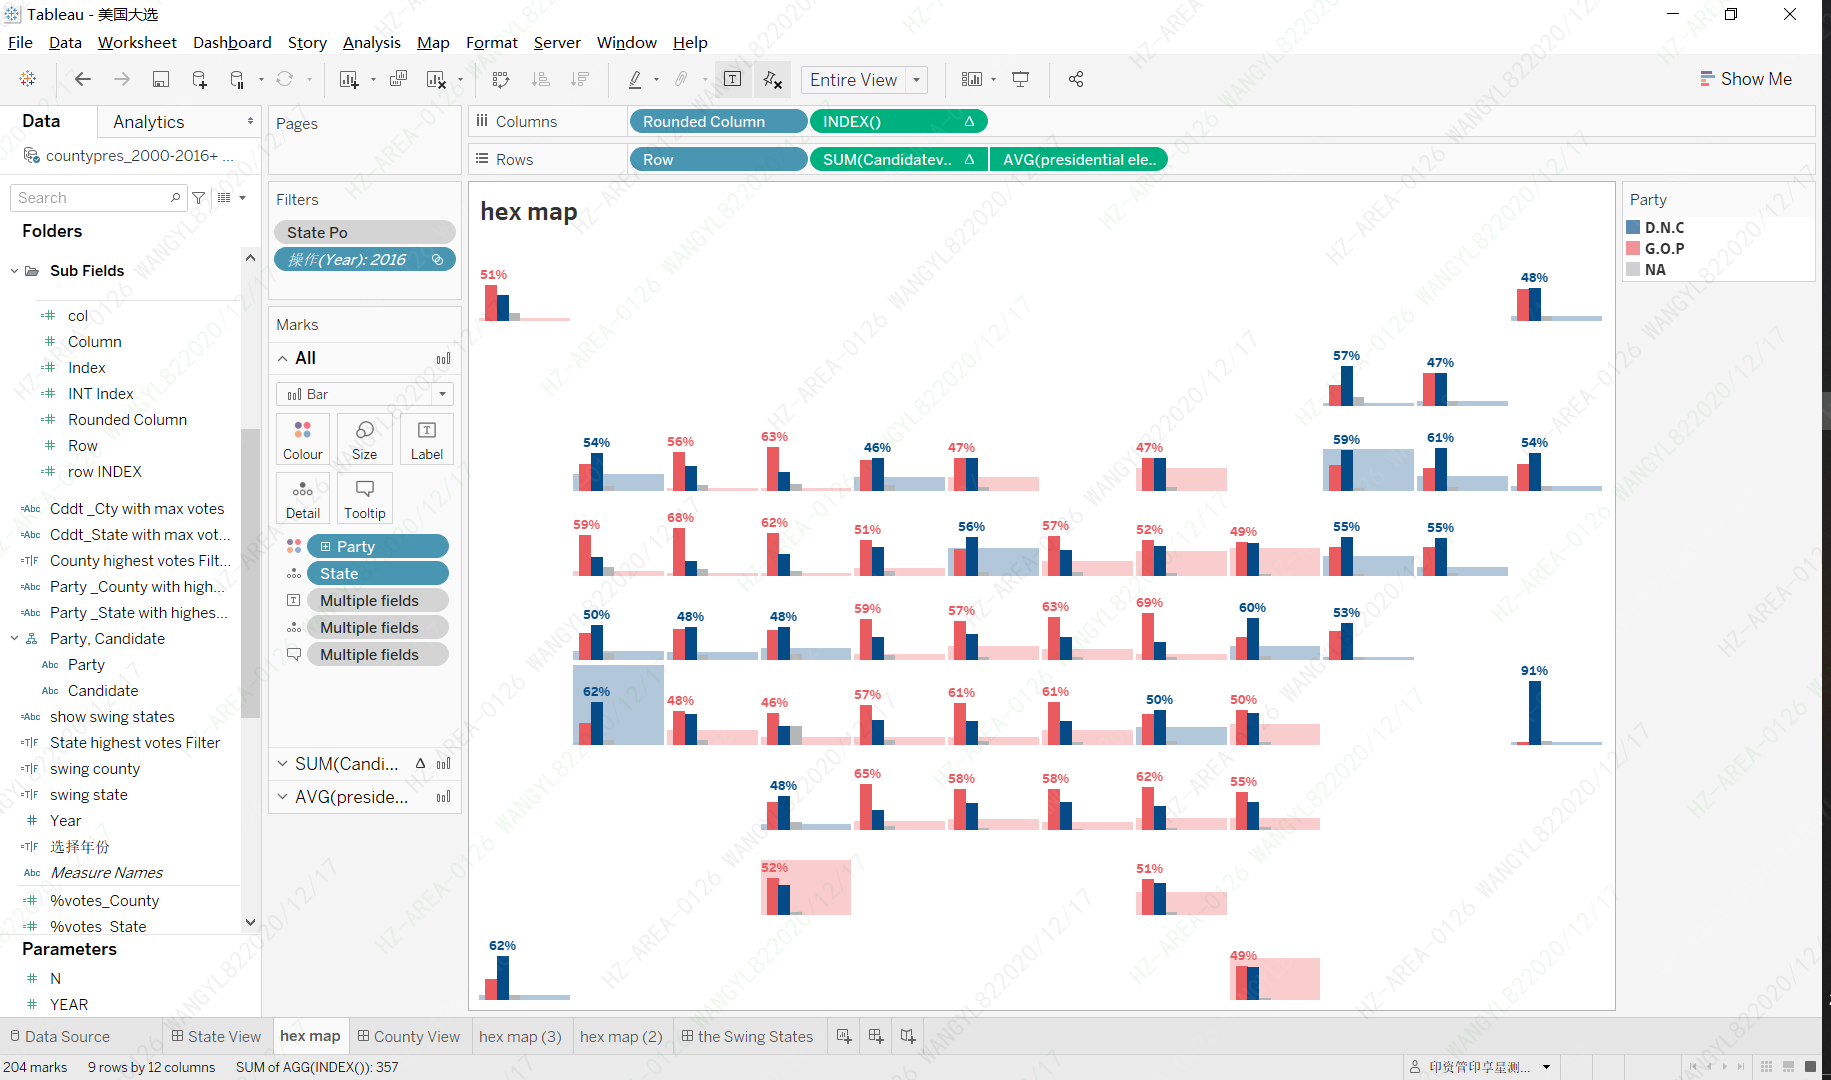
- I choose the tile map: I feel that tile map can easily eliminate the difference in the size of the United States, all of the continents can be easily read. About how to make a tile map, I recommend this article by Tamás, Creating Charts within a Hexmap.
- I try to show the major factors on the tile map, I use bar chart to show the percentage of votes for each candidate, and use the electoral votes to control the height of every background square. Then, very simply you can find who/which party get most of the votes in this state and how many electoral votes have been obtained.
- Find the party/candidate with the highest number of votes: I used some LOD expressions to find the party / candidate with the highest number of votes in each state / county. In the figure below, I simply draw the structure of this data set.

I also calculated the total electoral votes for each candidate. This will be used to determine who is the final winner.
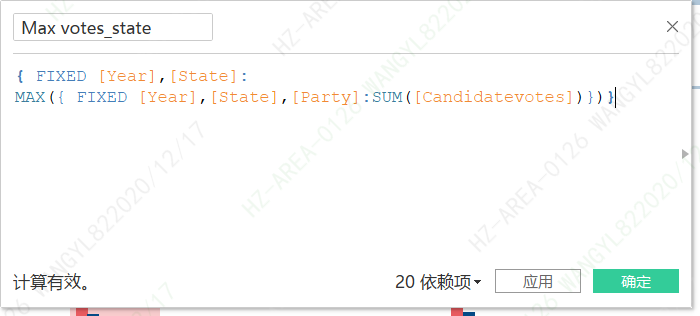
a) Calculate the max votes for each state:
{ FIXED [Year],[State]:
MAX({ FIXED [Year],[State],[Party]:SUM([Candidatevotes])})
}
b) Find which party/candidate got the max votes:
IF { FIXED [Year],[State],[Party]:SUM([Candidatevotes])} = [Max votes_state]
THEN [Party]
ELSE ‘LOSE’
END

c) Calculate the total electoral votes for each candidate:
IF { FIXED [Year],[State],[Candidate]:SUM([Candidatevotes])} = [Max votes_state]
THEN [presidential electors]
ELSE NULL
END

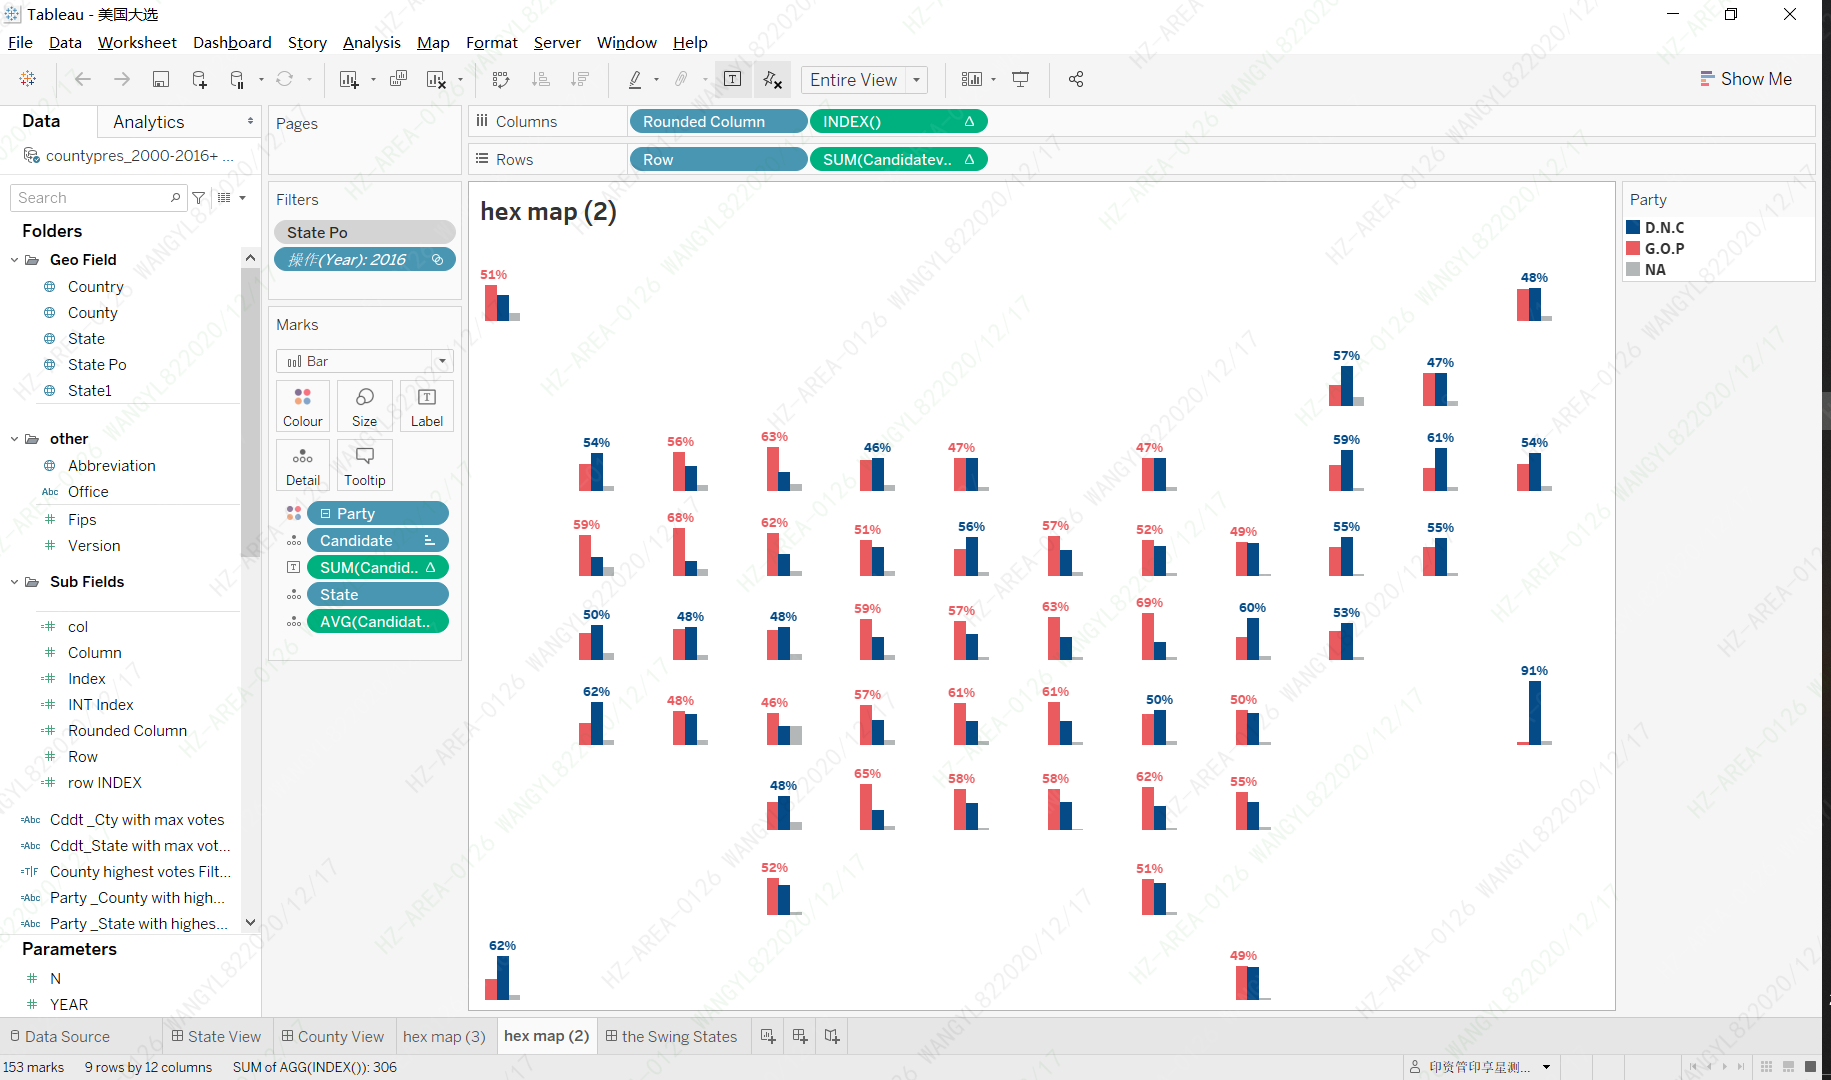
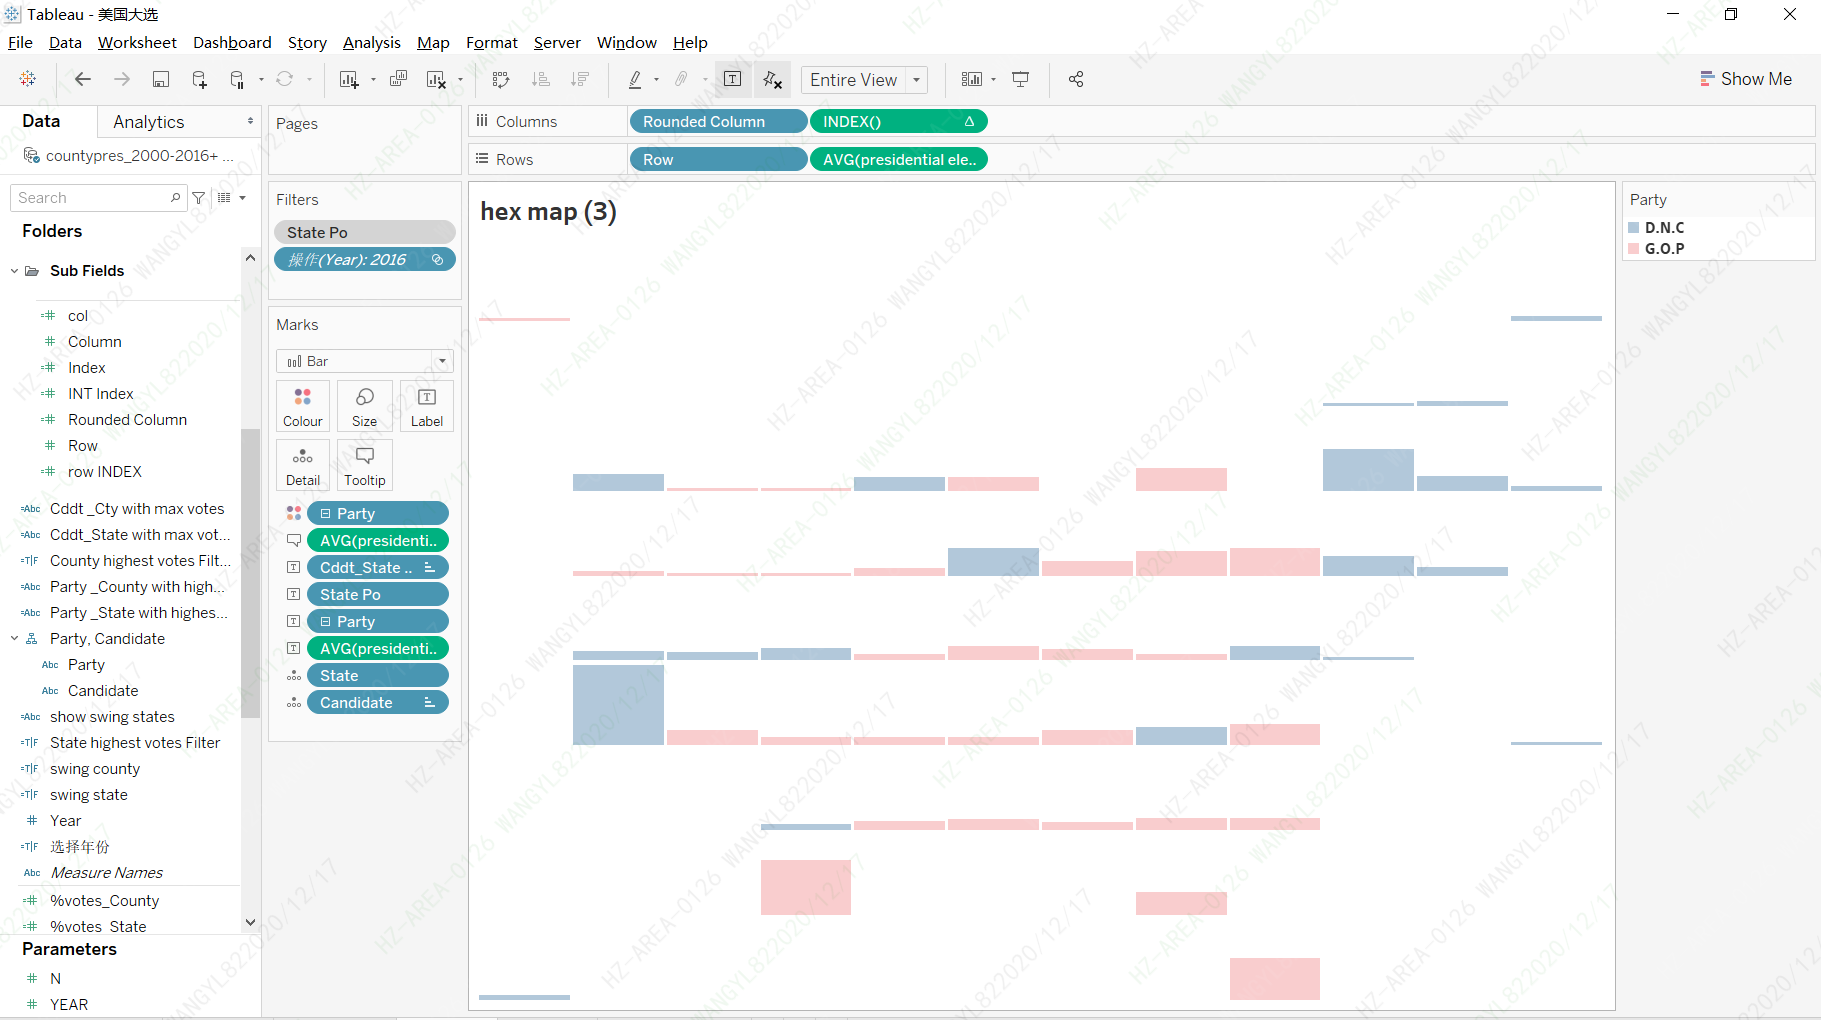
d) the pictures below show How I create the tile map with bar chat and the background square, and also the final composite graph.
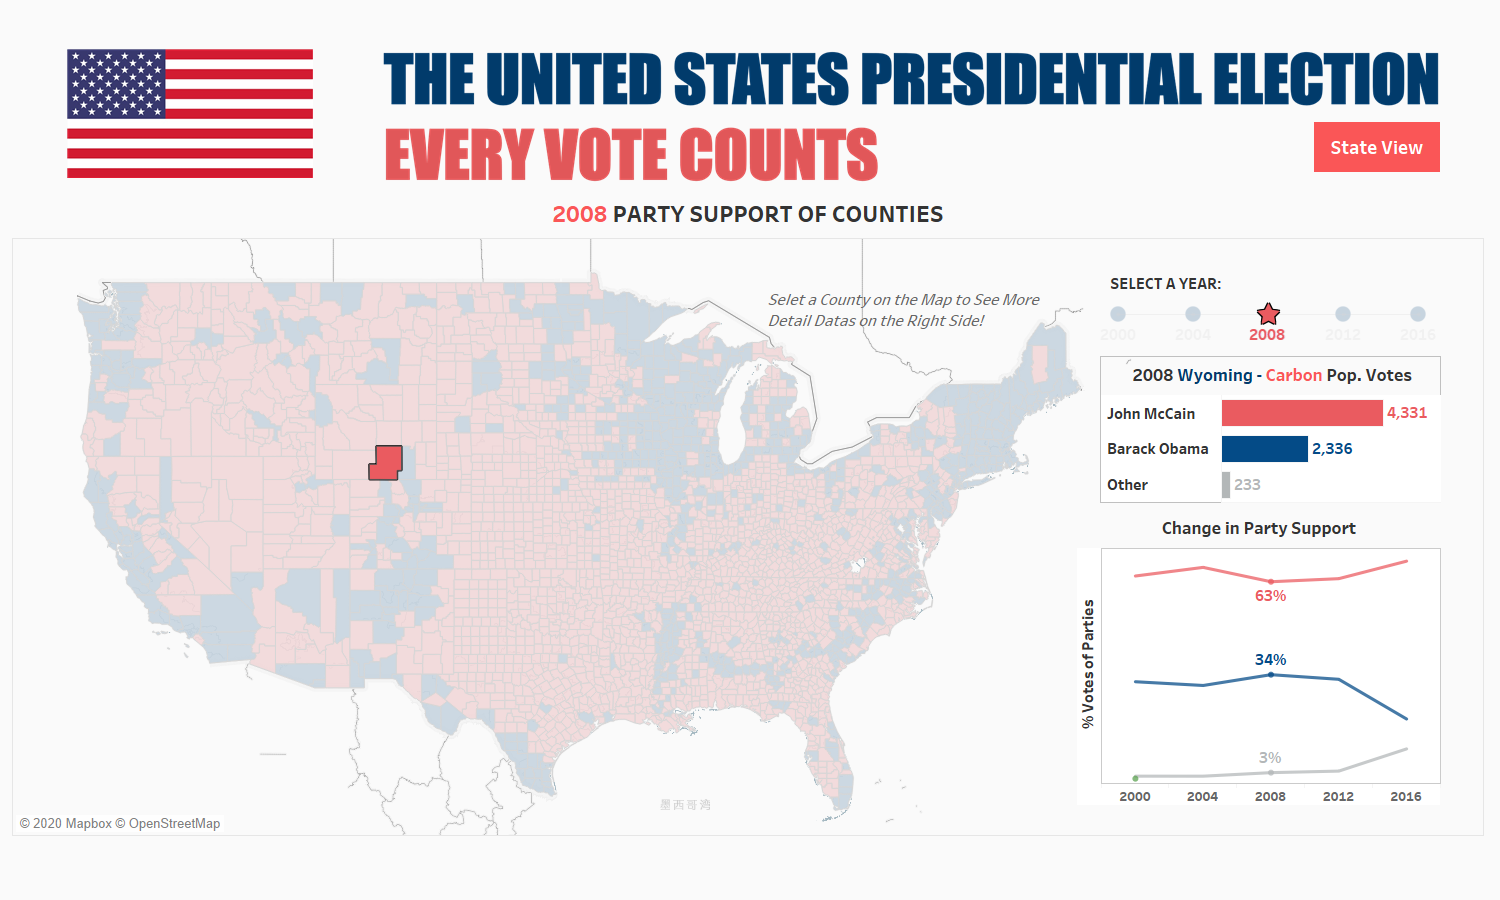
4. County View: I create a county view as well, to show the voting in each county. The calculation principle is basically the same as above. You can view the annual voting situation and trend as well of each county.
5. Find the Swing states: Here I take the states that have undergone changes in partisan support since 2000 as swing states. And highlight them in the tile map. And I use a bar chart shows their annual change in partisan support and the number of electoral votes each year.
Michael: Can you discuss how you use Tableau in your current work role ?
Yuli:
In our company, we tried to use data to lead out some problems that may exist in business links, assist business unit decision-making and implement some adjustment plans.
The company has been deploying Tableau and now employees can access standard analysis reports through Tableau Server, and the company also actively develop self-service data analysis culture in the organization.
Visual analysis is a useful way to explore and understand data. It supports and accelerates the analysis process. You can ask questions in the visual interface, get answers, and ask follow-up questions. As an efficient visualization tool, Tableau accelerates the analysis process. For example, when making independent analysis, it can directly access the data source through tableau according to the analysis requirements, make analysis reports, and directly export to PPT / PDF to generate static reports. For some standardized reports and analysis reports, you can also publish them to server and share with others.
I also actively promote data culture in the company, encourage business department colleagues to use data, and achieve the transformation from passive to active self-service analysis. After all, business people from the front line are the people who understand the business most and can maximize the value of data.
Michael: Can you tell me your three favorite Tableau tips and tricks?
Yuli:
- Recently, Tableau officially shares a very useful tip about How to create automatic small multiples?
a. Create a sequence number field:
INDEX()-1 //calculation based on a dimension
b. Get the best number of each row:
INT(SIZE()^0.5)+1 //calculation based on a dimension
c. Create a sequence number field for column:
[Index-1]%[ Best Number_Row]
d. Create a sequence number field for row:
DIV([Index-1],[ Best Number_Row])
2. Application of multi-layer map in non map scene:
Use multi-layer map to create a sunburst I added a video link here!
Using the function of multi-layer map, we don’t need to do some complicated source data processing to create sunburst. This is really cool!
3. Composite graph with conditional formatting: Display multiple different forms of charts in one view, HERE IS THE VIDEO LINK
This makes it possible to monitor multiple indicators at the same time.
Michael: Can you tell me a few sites that I would want to visit if I were to go to Hangzhou, China?
Yuli:
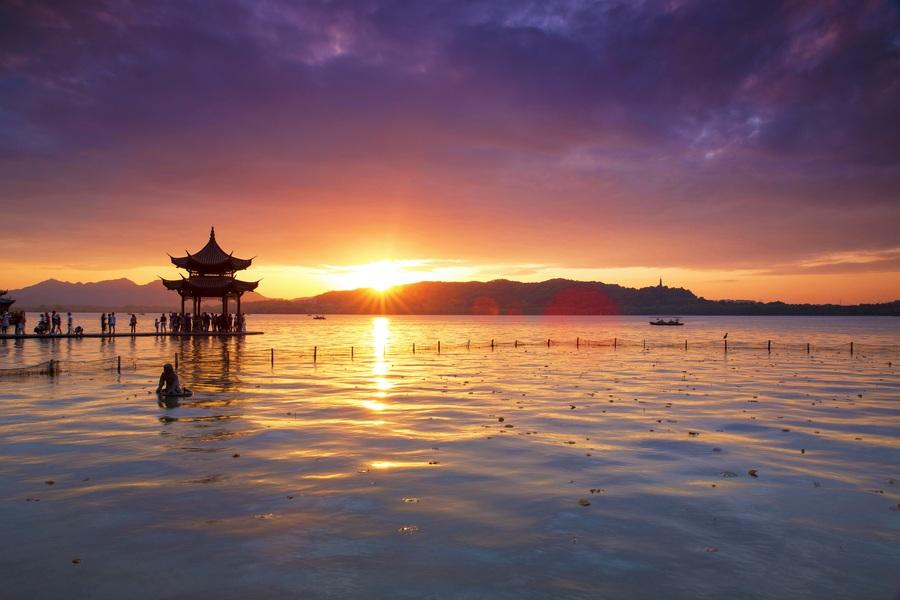
Hangzhou is a city with both historical charm and modern flavor. It is quite famous for the West Lake (Chinese: 西湖; pinyin: Xī Hú; Wu: Si-wu). The name of West Lake was fixed as early as in the Tang Dynasty. In the Song Dynasty, the Chinese famous poet Su Dongpo wrote a poem to praise the West Lake and compared it to Xizi(The first of the four beauties in ancient China). Since then, the West Lake has another beautiful name Xizi Lake. And as it lies in the west of Hangzhou, it is usually called the West Lake.

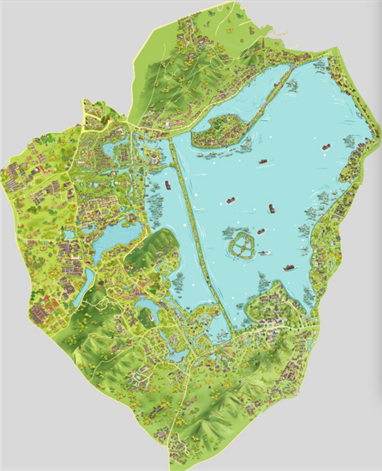
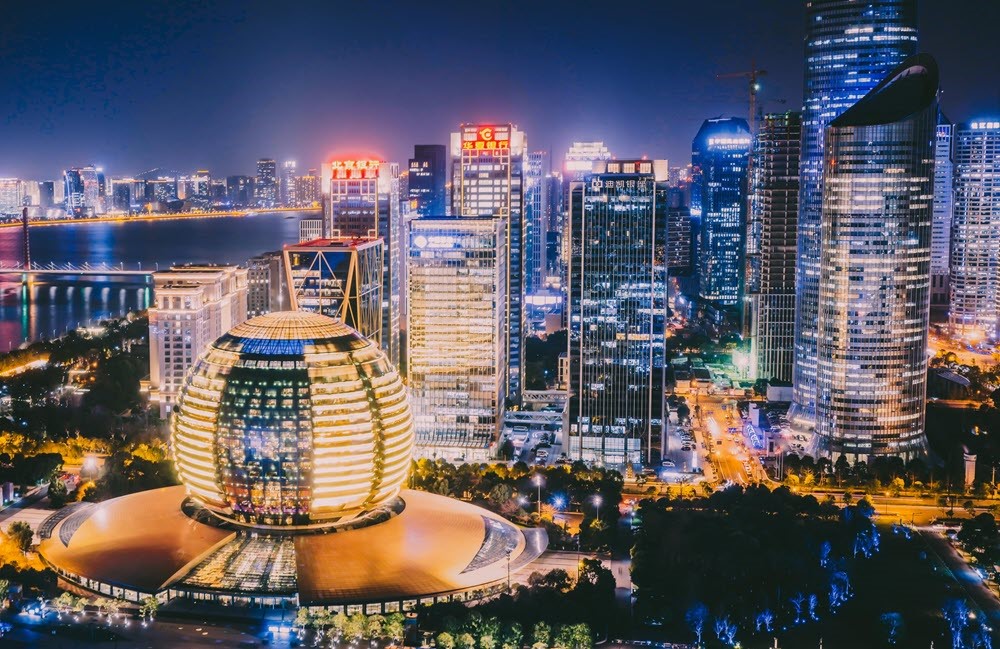
It is one of China’s best known scenic spots. It was made a UNESCO World Heritage Site in 2011, described as having “influenced garden design in the rest of China as well as Japan and Korea over the centuries” .
It is a freshwater lake with a basic pattern of “one mountain, two towers, three islands, three banks, and five lakes”. It covers an area of 6.38 square kilometers. The average depth is 2.27 meters with he deepest being 5 meters. The lake is divided into 5 parts by the causeways of Su Causeway, Bai Causeway, and Yanggong Causeway. and there are numerous temples, pagodas, gardens, and natural/artificial islands within the lake. Three sides of the lake are surrounded by green mountains and one side the modern city.
People in Hangzhou have their way of enjoying the beauty of the West Lake. According to the locals , The West Lake looks more beautiful on rainy days than on clear days, but it is at its best after darkness has fallen.
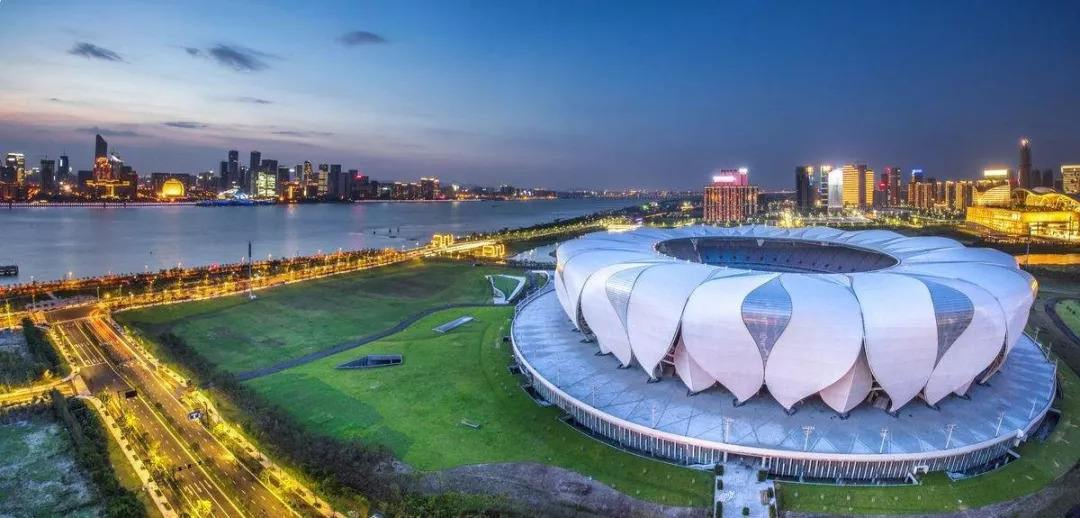
The 19th Asian Games will be held from September 10 to 25, 2022 in Hangzhou. So welcome to Hangzhou!

Michael: What is next on your “To Do” list? What can the Tableau community expect to see from you in the near future?
Yuli:
My “To Do” list
First, I will keep following some Tableau Community Project, try some new viz Challenge. Take opportunity to participate in the projects mentioned below.

Second, I will focus on some topics that I’m interested in:
- VanGogh’s self-portraits
I’m very curious about Van Gogh’s works, especially his series of self portraits. Now I am collecting some data about him, and plan to create a visualization about him;
2. Scuba diving
I like scuba diving, so I’m collecting some beautiful diving spots around the world, planning that one day I can create a visualization about scuba diving;
3. My work trip in New Zealand
I plan to create a visualization to record of my life and journey in New Zealand;
···
There’s a lot more I am interested in and want to do, so I won’t list them here one by one. 🙂
Tableau Public
Link: https://public.tableau.com/profile/yuri.wg#!/


Hi,Yuli.I am your fans. I am learning Tableau now, And I am very interesting in your Viz. Link: https://public.tableau.com/app/profile/yuri.wg/viz/V_1_0_15778836035430/1 , but I can’t download it. Could you share the .twbx file to me?