

Swati Dave Bio
I come from an industrial township in India – Bokaro Steel City. So engineering was the most obvious choice while growing up. I was lucky to join the leading Software Consultancy firm in India – TCS. I had an inclination towards data and found myself a good fit in a MIS team which later became the COE (Center of Excellence) for MI and Reporting for the client. I also earned my Green belt in Lean Six Sigma here. I got exposure to work on SAP Business Objects, Xcelsius and other BI tools like Cognos, MSTR and Qlikview. I got an opportunity to work in US – Chicago for a year which was a very enriching experience. Professionally it gave me good exposure as I got to head a major migration project and work with my clients directly. Personally it was an enriching as I experienced new culture and visited so many new places.
Currently I am living with my family for past 10 years in Singapore. I have been working with my current employer for 5 years now as Senior Data Analyst. In this role I am responsible for producing reports and dashboard for the Risk department. I am passionate in providing reporting solutions which are automated and scalable.
When I am not working I like to spend time with my son, do crafts with him, draw mandalas and cooking. Outdoors I picked up a dragon boat a couple of years back and love paddling with my Dragonboat team. This year, I have taken a break from it but looking forward to join them soon.
Fun fact: I am a 1st degree black belt in Karate and use to compete at the National level. I have won the National Championship twice.
QUESTIONS
Michael: Hello, Swati. I really liked your #MakeoverMonday for W36-2020. Can you tell my readers the process you followed to analyze the data, design and then build this dataviz? Also, can talk a bit about Figma and how you used it in this instance?
Swati: Hi Michael! Thank you for including me in your Tableau Community Spotlight series! It has been wonderful knowing other Community members through your blog and I am thrilled to be included!
For MOM, my typical process is to download the data and build quick graphs to get familiar with data. I then read the supporting articles provided in the challenge to understand more about the topic. I try to timebox myself and complete it in one sitting.
This week’s challenge was quite fun. Thanks to Michelle Frayman for sharing the data set and great job by her boys in building the vizzes.
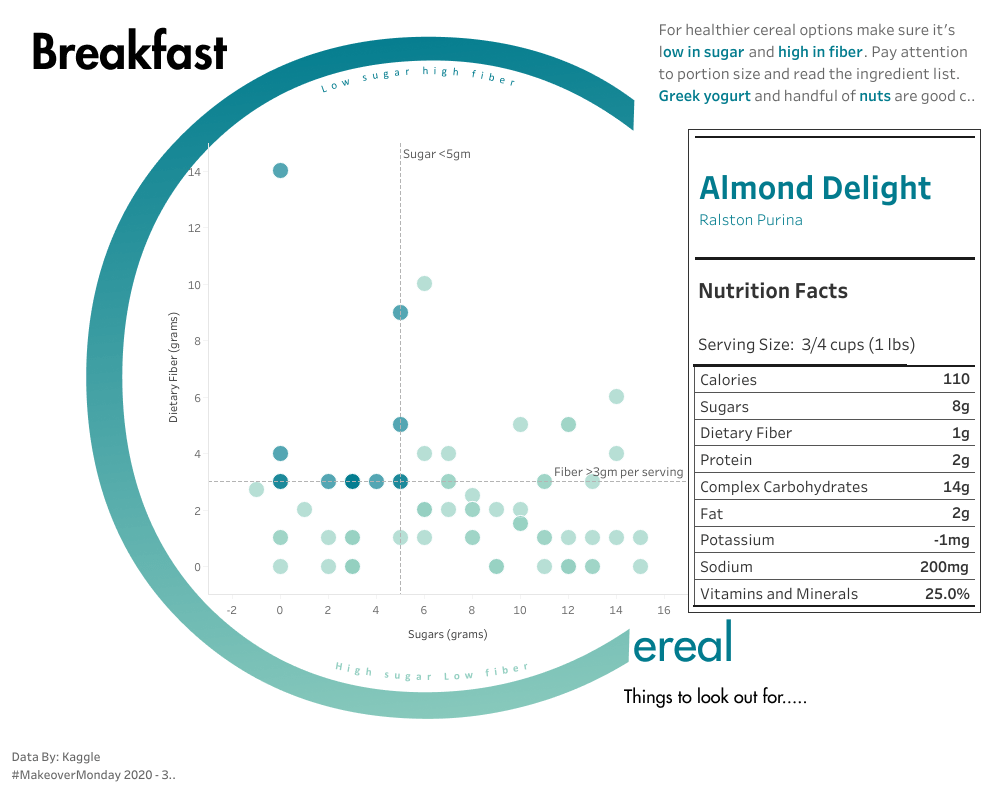
After analyzing the data and reading the article I decided to focus only on 2 nutrient facts (i.e., sugar and fiber). I choose a scatterplot as it provides clear comparison between the 2 components. The article also talks about the healthier limit for sugar < 5gm and fiber > 3gm. So I thought of including them as reference lines. To emphasize cereals which meet both these health limits, I colored them in dark teal. I choose teal as this was the color used throughout the article as well.
Since the topic was cereals, I immediately thought of mimicking the Nutrient labels which we typically find in cereal box in my viz.
I have seeing many people in the community using Adobe Illustrator and other design tools. I really wanted to try using anyone of these, but I picked Figma as it is free. For design inspiration, I have a habit of keeping a few boards in Pinterest on visualizations, posters or design etc. The design below inspired me – https://coasttocoast.studio/the-times/2017/10/2/3lv45mi7mko81t5syopn5u9qelq6az

The design was pretty easy to build in figma. I found figma very easy to scale and place it in Tableau as compared to PowerPoint which I have used earlier.
To be honest I did not expect such positive response from the community. Will Strouse (@dataNOTdoctrine) suggested adding gradient to the big C and use it as label. This was a brilliant suggestion which was easy to tweak through figma.
Michael: You are a Senior Data Analyst at Standard Chartered Bank. Can you discuss how you use Tableau in your current role and a little bit about what you do there?
Swati:
I joined SCB 5 years back in a team which was exploring to move their reporting process from manual Excels to database and reporting tool. After doing a POC on a couple of tools, Tableau was our choice of software. I was tasked to design dashboards and reports based on user requirements. I am proud to say that we were one of the first few in our bank to have rolled out enterprise Tableau server. We support a large number of users spread across the globe. We have also automated our canned report generation through tabcmd which is a huge time saver for our team.
Currently we are working towards automating our data massaging or preparation process using Tableau Prep and python.
Michael: Can you tell me your three favorite Tableau tips and tricks?
Swati:
#1 Use of unicodes to enhance your visualization. One tip when using ▼ ▲ for showing movements or change in numbers, please use decimals else it might show wrong movement. This becomes critical when you are dealing with financial reports.
#2 Copy formatting from another viz. It is an absolute time saver.
#3 Using Fixed LODs, this is quick way to get correct $$ values which otherwise multiply due to duplication of data.
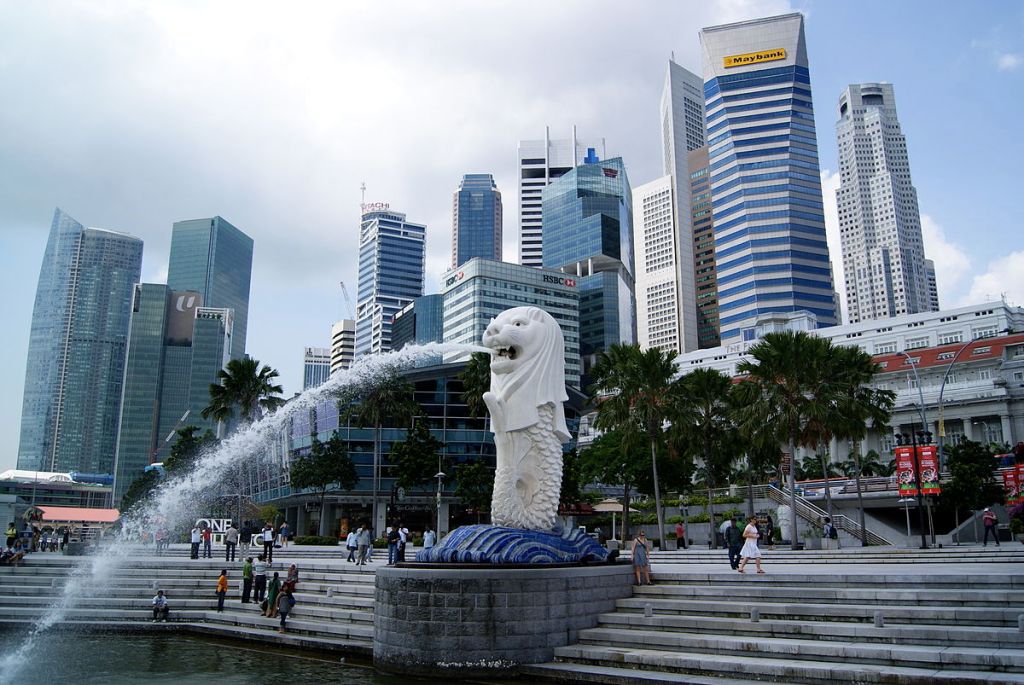
Michael: If I were to visit Singapore, what sites would you recommend I visit?
Swati: If you are in Singapore we must meet and if you like I would love to guide you around. There are so many places to visit in Singapore. To name a few, I would suggest taking a boat ride around the Singapore River. Visiting Gardens by Bay and seeing the light show they have at night. The Tree groves look surreal at night.

Enjoying night life and good food at Clark Quay.
Michael: What is next on your “To Do” list? What can the Tableau community expect to see from you in the near future?
Swati: Oh there is so much to learn and I have a long way to go. I would like to keep up with various community projects such as #IronQuest. There are a couple environmental topics which I have in my mind which I want to visualize.
Also I would like to work towards helping others learn and grow.
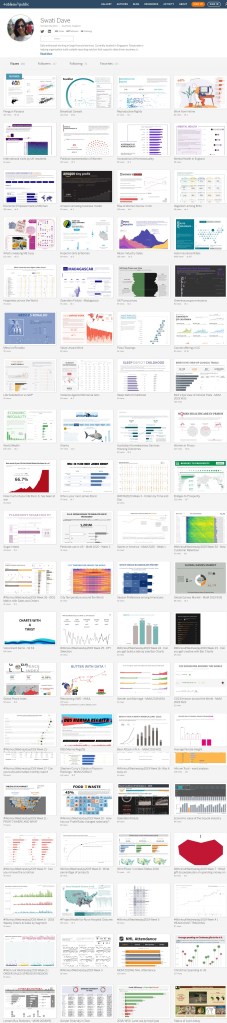
Tableau Public
Link: https://public.tableau.com/profile/swati.dave#!/

thank you