
Kate Brown Bio
I’m a Business Intelligence Manager and focus on creating, curating, and visualizing data. I fell into an analytics career and never imagined this would be a career path for me. I majored in History in college and have a minor in education. When I realized teaching was not what I wanted to do I had a couple of call center jobs. In one of those roles, I taught myself how to pull reports out of a ticketing system we were using and had a leader take a chance on me by hiring me as an analyst. I believe, my liberal arts education and experience in customer service roles has helped me in my career.
QUESTIONS
Link: https://fairwaysandviz.com/
Michael: Hello, Kate. You have some great tutorial posts on your blog, Fairways and Viz related to Tableau Prep. Can you tell my readers why they should learn Tableau Prep and how it can help them manage their data?
Kate:
Hi Michael, I love Tableau Prep!
I always try to do as much data cleaning and manipulation upstream of desktop. I believe that creating a data set that is optimized for Tableau is the most important part of creating dashboards. Analysts and Tableau developers may not always be comfortable with SQL, may not have the ability to create custom datasets in their data warehouse, and may have to combine multiple data types for their dashboards. I believe that doing that work in Tableau Prep instead of joining, blending, and cleaning in Desktop, gives you a better foundation to build your end solution.
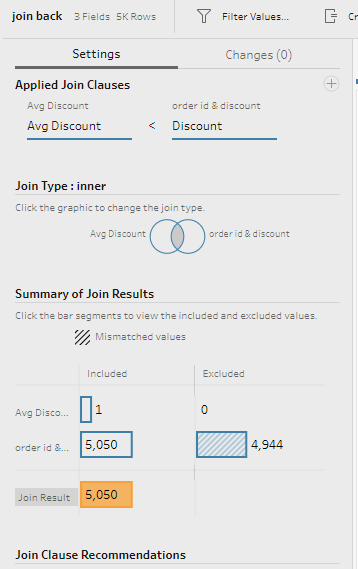
I also use Prep to prototype complicated SQL. The ability to see the difference in join types in Prep is amazing. I can quickly pivot between join types to understand the impact on my data. When I start working with a new data set, I always bring it into Prep. For me, the visual clues and results in Prep are better than looking at rows from a query.

Michael: You are a Business Intelligence Manager at Skillsoft. Can you discuss how you use Tableau in your current role and a little bit about what you do there?
Kate:
Sure, I started my role with Skillsoft at the end of June. I worked at my prior employer for 22 years and was ready for a new experience. I’m part of the Business Intelligence team at Skillsoft and focus on creating data sets and visualizing those with Tableau. I will also be working on supporting and enabling our explorer users.
Michael: Can you tell me your three favorite Tableau (or Tableau Prep) tips and tricks?
Kate:
- In Tableau Prep, you can overwrite an existing field by creating a calculated field with the same name. Say I have a field called account number field that comes out of my data source with a “_” at the end of the number. I can create a replace calculated field that replaces the _ with ‘’ and call that field account number and it overwrites the existing field.
- Unions in Tableau Prep may be my favorite thing in data prep. In Prep you can union data sources that have different field names and different data types. Using the union with field merge functionality is amazing!
- MIN(1) in Desktop. One of the more common chart types I have used in desktop is a progress bar (x% of 100%). Rather than showing just a bar chart I do this as a dual axis and make my value a color and the min(1) in a light gray. It’s a simple chart but have found that my end users like to see the colored bar move closer to the 100%,
Michael: You seem to have a large Tableau community in the Boston area. What do you attribute that to?
Kate:
We have an incredible amount of talented data people in the Boston area. Three of our TUG leaders and two community members were just named Tableau Ambassadors (Jacqui Moore, Brian Moore, Will Strouse, David Borczuk, and Michelle Frayman). I’m not sure that I can explain the large concentration of talent but we’re very lucky to have a large engaged TUG.

Michael: So, after following you on Twitter and visiting your blog, I need to ask. What makes golf such a passionate sport for you?
Kate:
My father, grandfather, brothers, and nephews are all golfers. I grew up watching golf and my father took me to a driving range when I was a kid and I was hooked. The tangible things I love are being outside and the friendships I’ve made. For me golf is an incredible mental challenge, it’s helped me get over perfectionism and taught me not to get too far ahead of myself. You have to get over the past, not think about the future, and focus on the moment at hand. It isn’t easy for me to do that but when I can it is a meditative experience. A lack of confidence makes for a tough day on the course, like many people I suffer from a big case of imposter syndrome, and you can’t think that way on the course.
Michael: What is next on your “To Do” list? What can the Tableau community expect to see from you in the near future?
Kate:
That is a great question and one I am contemplating right now. I’m probably going to scale back a bit and work on some projects that have been half done for a while. I had an idea for last years music Iron Viz feeder that I still haven’t finished, so, I’m going to take my time and work on getting that done. I’m also talking with Christina Gorga about we can promote more women in the data world. I’ve always tried to champion those people who do good steady work that don’t get the recognition they should and I think that will be a mission of mine going forward.
Tableau Public
Link: https://public.tableau.com/profile/kate.brown#!/

Amazing knowledge and I like to share this kind of information with my friends and hope they like it they why I do
360DigiTMG
Great Article it its really informative and innovative keep us posted with new updates. its was really valuable. thanks a lot.
best training institutions
Great Article it its really informative and innovative keep us posted with new updates. its was really valuable. thanks a lot.