
Frederic Fery Bio
Frederic drives innovation in the healthcare sector in Queensland, Australia by day and a Tableau data visualisation enthusiast by night.
Frederic has a passion for data story telling and enjoys using Tableau to viz about politics, sport, Aussie social issues & social good.
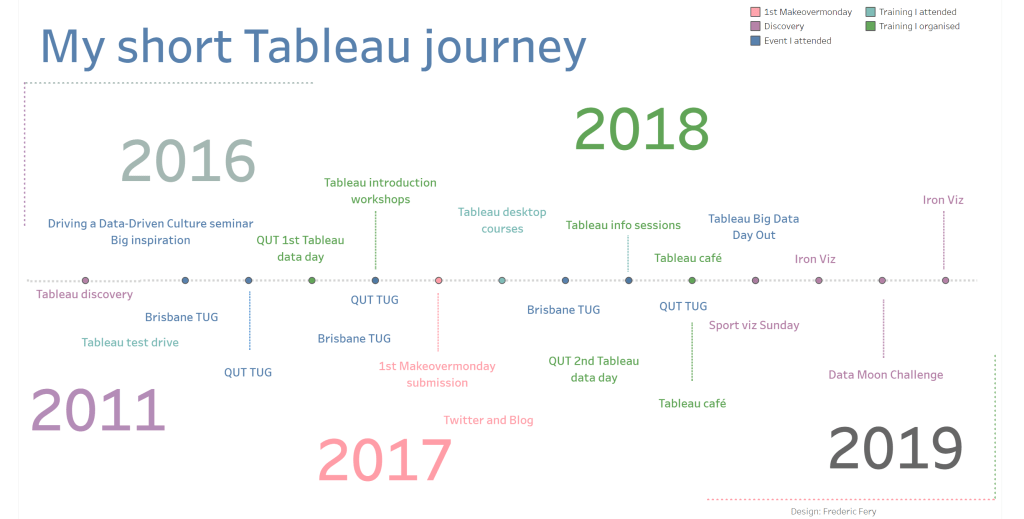
Frederic got his first Tableau light-bulb moment in 2016 while attending a Tableau test drive, then discovered #MakeoverMonday thanks to Rob Crocker then never looked back.
Frederic says that Tableau is just a hobby (he often wonder if he should make the plunge!) and he really thinks Tableau rocks (see LinkedIn post).
Continuing on, Frederic comments,
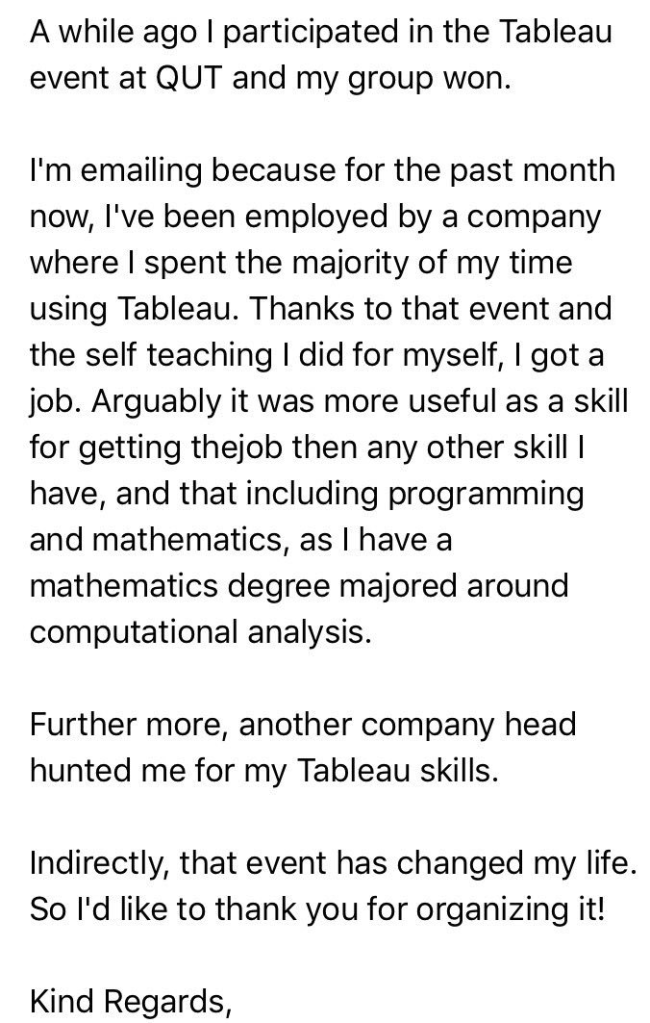
In my previous job at QUT (a University in Brisbane), I developed a Tableau day (LinkedIn post) to teach students about dataviz. The Tableau day was divided into an initial three-hour training session, followed by a data visualisation competition that challenged students to create a story based on generic data set. Students were divided into teams, had about an hour to develop their stories and then each teams presented their visualisations in front of the judges.
My other light-bulb came when a student that participated sent me this nice message (screen shot below), saying that this event and Tableau changed his file.
I often get a call from my ex-QUT colleagues to run Tableau test drive/guest lectures, I really enjoy this. In my current role in the eHealth Digital Innovation Team, I’m helping drive digital innovation for Queensland Health (Queensland public health).
In a nutshell, we help clinicians and staff try new technologies, solve problems and improve patient outcomes. We test the new technologies – no Tableau or data analysis role here.
QUESTIONS
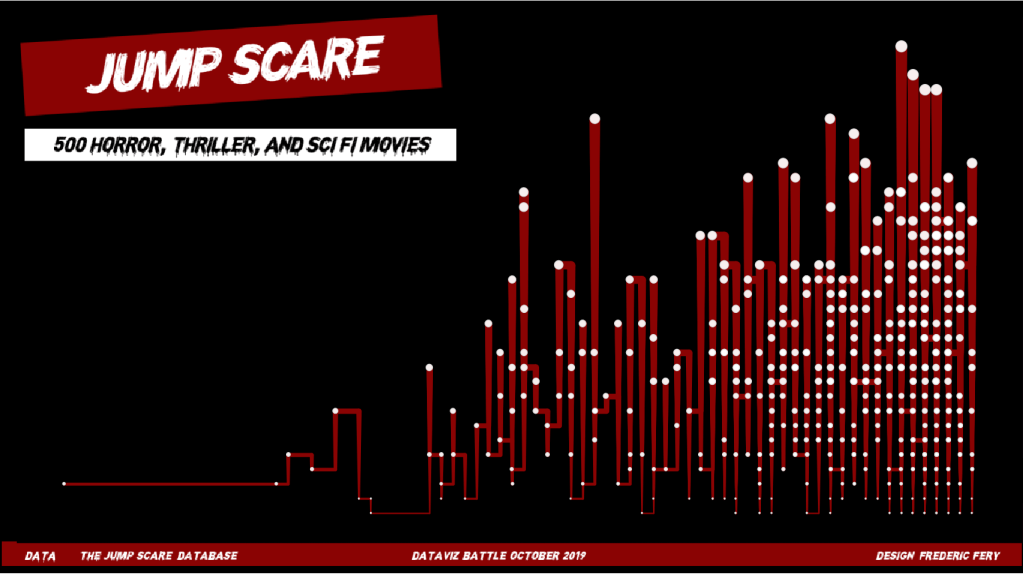
Michael: Hello, Frederic. Congratulations on your Jump Scare #VOTD back in October (right in time for Halloween). I really love this dataviz. Can you tell my readers the process you followed to develop this (e.g., find the data, analyze, and design the dataviz)?
Frederic:
Thanks, it was really awesome to get my first #VOTD. It was part of a Data is Beautiful monthly challenge. Data was provided to us.
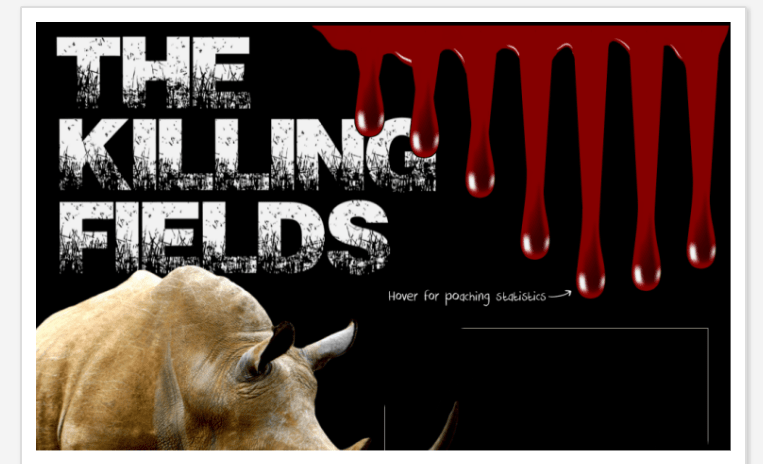
I was originally inspired by Ken Flerlage Killing Fields (Rhino Poaching) data viz and the blood drip effect. (i.e., horror movie = blood) After a few trials and errors, I wasn’t happy with the outcome and thought that the design I came up with worked better with the “jump” concept. I still stuck with the black and red.
Michael: You are the Innovation Engagement Manager for eHealth Queensland. Can you discuss why data is so important for your job and public health?
Frederic:
My role as Innovation Engagement Manager is not a data related job (i.e., I don’t work with BI tools). As I quickly explained in my short bio, we try new technologies, and these could be data related technologies, including Machine Learning.
I work very closely with the Clinical Business Intelligence team and delivered for them last year the first Business Intelligence Showcase. This was a big event with 400 staff. The purpose was to showcase existing BI projects/projects, inspire and show staff what’s coming up.
I might be bias, but I think QLD Health is leading digital healthcare innovation in Australia by embracing technology to transform the way we care for our patients.
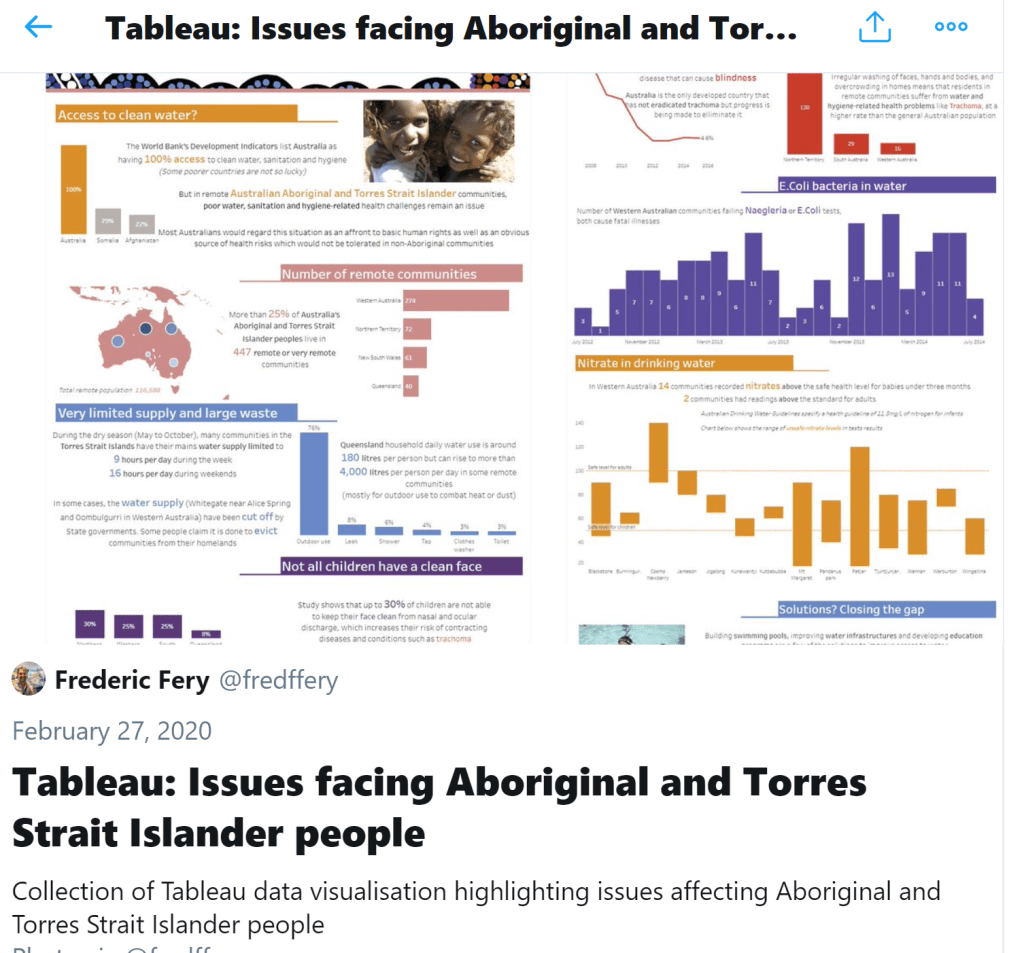
Michael: Your recently posted on your website a blog post titled Highlighting Australia’s First Nation people issues with Tableau data visualisation. Can you tell my readers why it is important that we understand the issues affecting Aboriginal and Torres Strait Islander people in Australia?
Frederic:
As I said I really love Tableau because it allows me to tell me stories, not really heard before in this medium. I was called once a #Datactivist, I took this remark as a compliment!.
Australia is a bloody amazing country but still plagued with racism towards our first Nation people. To be very blunt, English people (Caption Cook) first arrived in Australia in 1770, then colonized the land. There are lots of stories are murders, rapes, land disposition and much more. In Australia, it is still taboo to talk about these issue. Still now, professional indigenous players (some not all) have been abused by the crowd and called monkey names!
I feel like Tableau enables me to tell these stories. The majority of my Tableau network is overseas and would have no clues, it helps educating people.
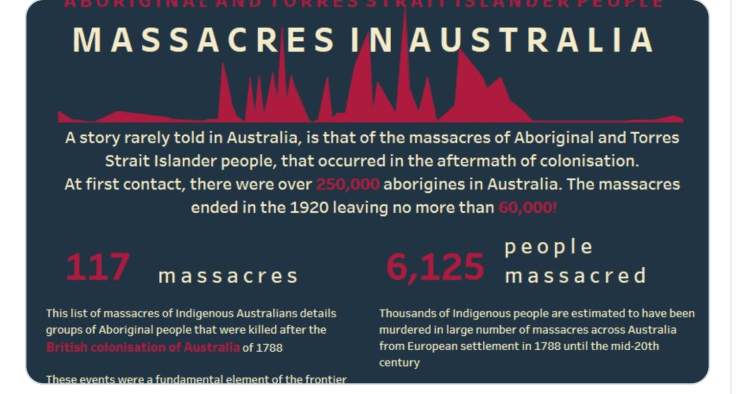
After posting the below massacre viz, I got lots of very good positive feedback (and some negative too), that encouraged me to tell more. An historian contacted me and he was keen to provide me with more data. The viz only shows about 6,000 people massacred, which is the data I got from Wikipedia, but people indicated there were many more massacres. (not documented officially).
The stories about Aboriginal and Torres Strait island people are not always sad.
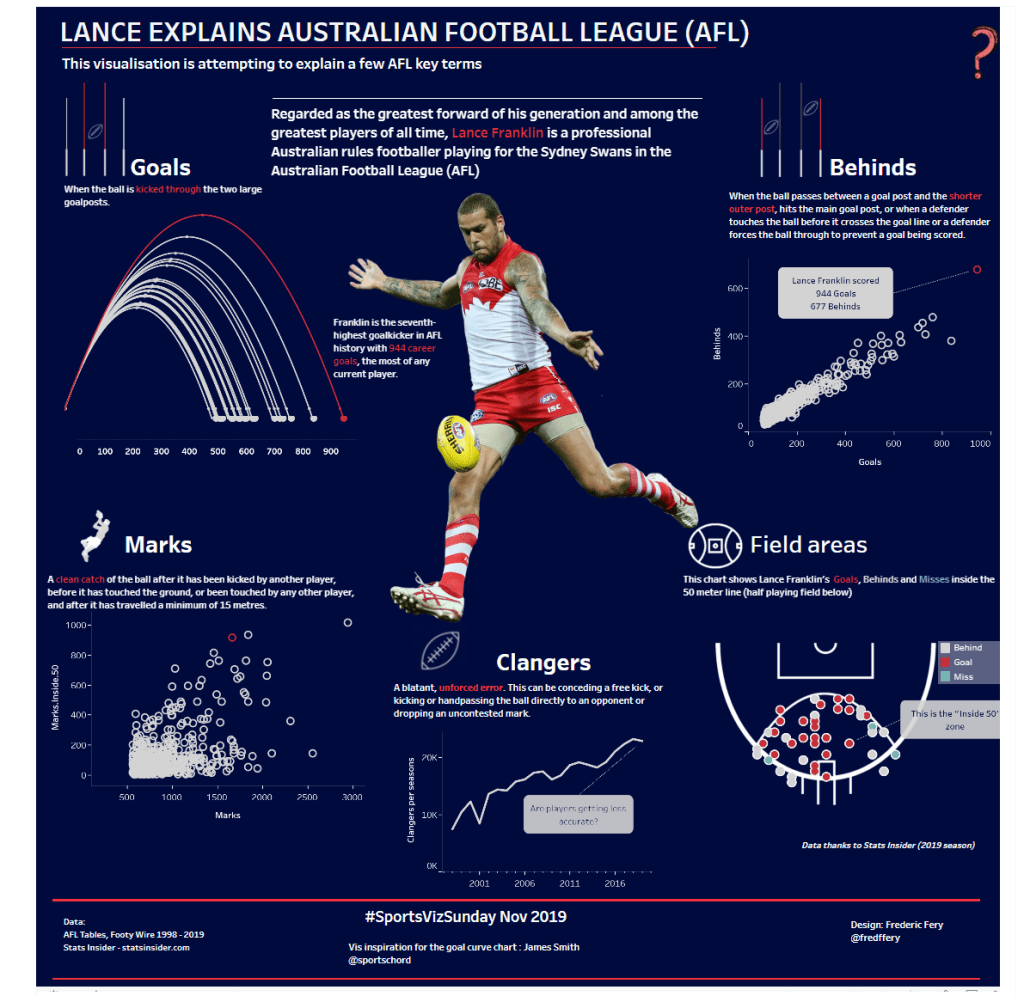
My second #VOTD (way!!) is explaining what Australian Football League (AFL) through the eye of one the best AFL players, Lance Franklin, who happens to be from an Indigenous Australian heritage.
I could keep going, as so many stories must be told!
If you are interested, I am keeping all of these stories in the Twitter Moments below
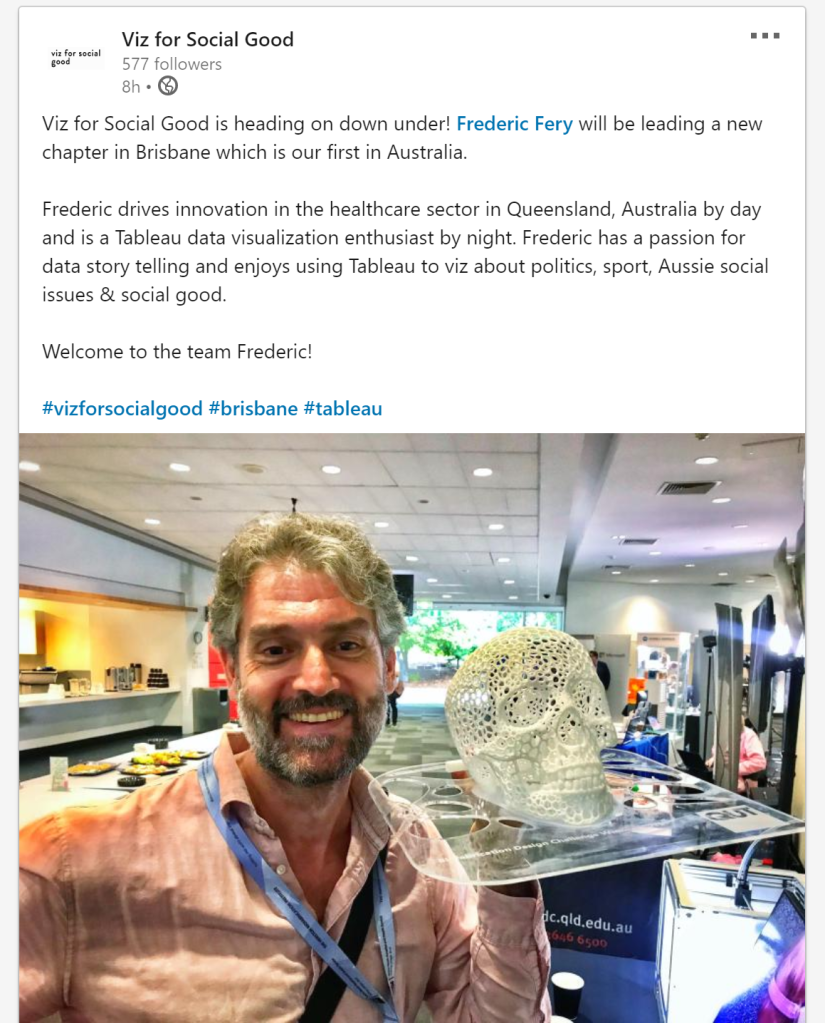
Michael: You recently started a Viz for Social Good Chapter in Brisbane, Australia. Can you tell us about some of your upcoming activities and how we can help?
Frederic: Yeah I’m pretty stoked to start the first Viz For Social Good chapters in Australia – we are putting Brisbane on the map!
The event has just gone live!. All volunteers will have until March 31 to come up with insights. I’m also organising a Datathon on March 19 for the local Brisbane data enthusiasts to present their findings to Sunny Street, (The Organisation). So far, we have we have close to 60 people registered for this live datathon. If you read this and keen to join the Datathon, register here.
Sunny Street is changing the world. They provide healthcare to homeless and vulnerable people in the street. They value conversation-based model of care. And they need help with their data…
For months, I always wanted to lead a Viz For Social good chapter in Brisbane, so exciting! I do event and build communities for work so that aspect is fine. Data Prep was a challenge.
Michael: What is next on your “To Do” list? What can the Tableau community expect to see from you in the near future?
Frederic: I’m already pre-planning the next Viz For Social Good and looking for the next organisation we can work with. So if you know anyone?
I’m also keen to help coordinate a hands-on Brisbane Tableau User Group. (if anyone has ideas??, I was thinking live #MakeoverMonday?)
I’d love to be able to come to TC at some stage, I have started saving!
Happy vizzing and thanks for the opportunity.
Tableau Public
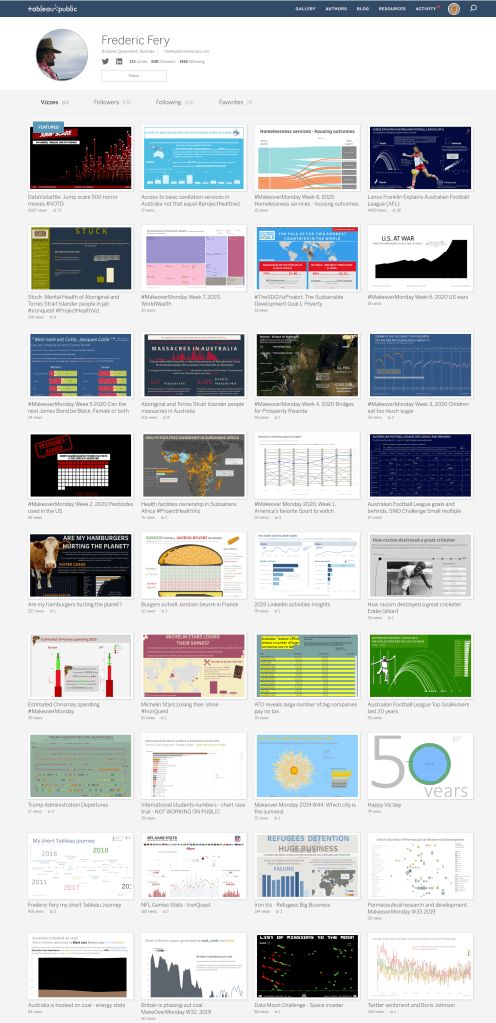
Here is a small sample of some of Frederic’s datavizzes on Tableau Public.
Link: https://public.tableau.com/profile/fredfery#!/

2 thoughts on “Tableau Community Spotlight: An Interview with Frederic Fery”