
Maria Brock Bio
My name is Maria Brock, I was born in Michigan but consider myself a Virginia native as I’ve spent most of my life near the Washington D.C. area. I’m a senior at George Mason University studying to get my Bachelor of Science in Economics and minoring in Data Analytics. I’m a Tableau Student Ambassador and I teach Tableau workshops on my campus as well as coordinate with the global Tableau Academic team to help as many students as possible get free Desktop licenses. I recently published The Tableau Student Guide which is a big website filled with tips, tricks, and resources to help newbies learn Tableau basics: http://www.thetableaustudentguide.com
Website: http://www.thetableaustudentguide.com
Tableau Public Portfolio: https://public.tableau.com/profile/maria.brock#!/
QUESTIONS
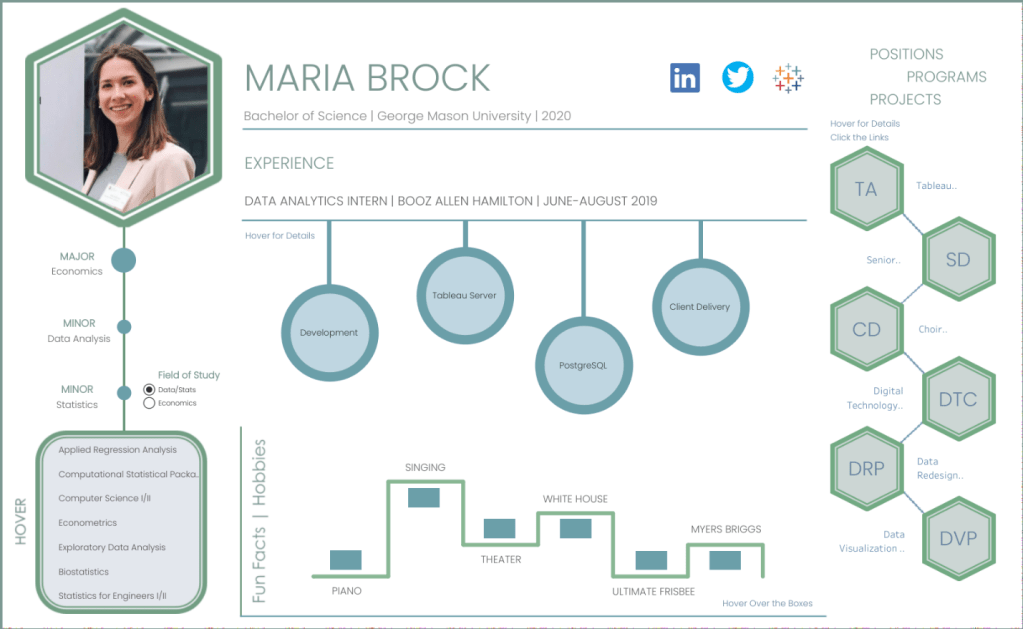
Michael: Hello, Maria. I want to talk a bit about your interactive resume. I really, really love this! Can you talk about the process you followed to design and develop this in Tableau?
Maria: Thank you so much Michael! My resume was definitely interesting to create. I decided to create an interactive resume after one of my coworkers suggested it, and I realized how valuable it is to have a resume dashboard that literally shows your Tableau skills! When I looked at Tableau’s interactive resume gallery and other examples, I noticed that there were a lot of gantt charts and skill bar sections used and I got a little discouraged. At that point in my life I didn’t have much experience, so I didn’t really have an experience “timeline” that I could create a gantt chart with, and I didn’t like self-quantified skill sections because they’re too subjective. I decided to close Tableau and sketch out design ideas on paper. My resume is definitely “content driven design” and “design driven structuring”. I knew that I had to be creative in my chart types because of my minimal experience, so I decided to go with these shapes and hovers you see to highlight things like programs, projects, and positions I’ve had. I also included a section where people can hover over the classes I’ve taken and learn what exactly those classes teach. I also knew I wasn’t using this resume for purely business reasons so I wanted to include a personal hobbies and fun facts section. My resume is unconventional in design, but I’ve received positive reviews from people who said that they were interested enough to look further into my resume to play with it, so I consider that a win!
Michael: Your recently launched a website for student and newbies who want to learn Tableau and I think it is amazing. This is a real bonus for the Tableau community. Can you tell my readers a little bit about your site and the benefits it provides?
Link: https://www.thetableaustudentguide.com/
Maria: As I was teaching my workshops on campus, I found it tiresome to be sending so many different resources to different people asking every day, so I initially started building out a little resource site for my students. However, I realized that I could build this out into something beneficial for the larger community. The Tableau Student Guide currently has 30 articles made especially for students and non-student newbies. There are 6 sections: Getting Started, Building Basic Visualizations, Tableau Public, Connecting with the Community, Resources, and Student Interviews.
Getting Started helps newbies download Tableau Desktop, receive their license, and lists why it’s important and beneficial to learn Tableau in this day and age. I then run through building basic visualizations all the way from Show Me to Dashboarding. Then I move on to step by step guides to creating a Public portfolio and uploading vizzes and I include sections about Interactive Resumes, and community projects that can help in getting data for vizzes. Next I explain what the Tableau Community is and how they can connect with them over Twitter. My favorite section, Resources, is a big compilation of articles outlining blogs, podcasts, YouTube channels, and more. Everything I could find is there! And the final section has some interviews from students who have learned Tableau. I created the website to be a “one-stop-shop” to all things Tableau for beginners. Just within one week there were over 3,000 visitors to the site from across the world! I hope the site proves to be a tremendous resource to others, because I want other newcomers to have the same opportunities that I did when I started my journey with Tableau.
I created the website to be a “one-stop-shop” to all things Tableau for beginners.
Maria Brock
Michael: Can you tell me three of your favorite Tableau Desktop tips and tricks?
Maria: I’m definitely not very advanced with Tableau so I’m sure these have all been used before, but I’ll share the top tips that I use to make my life easier when building.
First, when I’m creating a tiled dashboard with many layers and sub-layers of layout containers, every time I drop a container onto the pane, I immediately assign it a border color according to the type of container it is, before I drop any worksheets or blanks in. I usually give an orange border to vertical containers and a green border to horizontal containers. This way, it’s easy to see your hierarchy and it’s simple to remove the borders after you’re done building.
Second, when building calc heavy dashboards, I always assign my calculation titles a symbol at the beginning like @ or //. This helps immediately group your calculations together at the top, and then it’s easy to place them into folders after that.
Third, assigning your worksheet a color is so helpful in determining which sheets belong to which dashboard, or the type of chart that’s used in your sheet. Just right click your worksheet and immediately assign a color. I know this is already widely known, but newbies might not be aware of this trick!
Michael: You are a Tableau Student Ambassador. Can you tell me some of the activities you have participated in as a student ambassador?
Maria: Sure! Student Ambassadors is a new branch of the Ambassador program, so this is the first year and the first group of student ambassadors ever! During the course of the year, we are tasked with hosting and teaching at least 4 workshops on Tableau to campus students. Past that, it’s up to the student ambassadors on how they want to use their role to help push forward the data community at their college. Some of the student ambassadors have been able to get their workshops accredited as a single credit semester class. Others have worked with the academic departments to help push Tableau as an analytics tool for the administrative department. I’ve concentrated on helping the college student body and the wider student global population. My university has a very small data analytics department, so I’ve expanded my reach to the computer science, statistics, and liberal arts departments. Last semester I taught a couple workshops to the general student population and to a business fraternity. I also held private tutoring sessions to those who needed. This semester I have some workshops set up with more structured student organizations like the Student Health Advisory Board, the American Statistical Association, and more business fraternities. As well as running the Tableau Student Guide, I’ve also been able to connect with other students across the world and become a resource for them when they reach out. The role has given me an incredible opportunity to help others and connect with the community on a deeper level.

Michael: In my MicroStrategy days, I use to occasionally go to Tysons (Corner) for training and such. I would think living in Washington, D.C. would be a bit surreal. Can you talk about some of the benefits of living in D.C.?
Maria: Living near Washington D.C. definitely has huge benefits. I live near my college about 35 minutes outside of D.C. so even though we’re close to the city it’s still on the ‘affordable” border. The metro system expands pretty far outside the city so it’s nice to have the easy reach of commute if you don’t feel like paying a fortune for parking or sitting in traffic. D.C. has a wealth of (mostly free) museums, galleries, parks, and monuments that you could spend a month exploring and still never run out of adventures. It’s definitely a booming area: I prefer to spend my time outside of the actual city, as places like Ballston, Rosslyn, and Tysons are quickly building nice areas to shop, eat, and live. The DC area, and that Northern VA area is also very nice because as you travel farther away from the city you can get more space and farmland (and more affordable living situations). My hometown is only an hour away from DC but you’ll see acres of farmland and a lot of cows and horses. It’s definitely a place to live around if you’re working in more of the government and government consulting sphere.
Michael: You are a Data Visualization and Analytics Intern at Lovelytics. Can you tell my readers the kinds of projects you work on?
BTW, Chantilly Jaggernauth was my very first interview for the Tableau Community Spotlight back in early 2017.
Maria: Working with Lovelytics has been amazing! I’m a month in and already I’ve been able to greatly expand my skills. I’m on Chantilly Jaggernauth’s team, so I deal with building out client dashboards that already have the data cleaned and prepped by either the client or another Lovelytics team that works more on the data side. I’m able to work a lot on the design side which I love. It’s been great practice in designing for clients that have specific requests, or have no requests at all and getting full reign to decide what design best suits their needs. Working at Lovelytics is awesome because I can see the diversity of skills among all the employees and it constantly amazes me at how good everyone is with their skills and their job. The company mainly deals with Tableau, Mapbox, Alteryx, and Tableau Training. I’m hoping that by the end of the internship I’ll have learned a lot more with Alteryx and data prep and also more of the heavy calculations and data sourcing that goes on behind the scenes. The best part of the internship has been learning from Chantilly and really honing the skills needed to build beautiful client dashboards and solidify best practices for design and chart types.
Michael: What is next on your “To Do” list? What can the Tableau community expect to see from you in the near future?
Maria: This semester I’ll be teaching more workshops at my college and I have some speaking engagements at different TUGs. I definitely want to work more on my presentation skills so I’m hoping that I can grab any opportunity that comes to speak in front of an audience and gain more skills and specialties as I move along with my Tableau knowledge. For the immediate future however, my main focus is graduating! I have less and less time to work on “extra” Tableau vizzes or projects as graduation nears. I’ll be taking a couple months off in the summer to relax and travel before I start my next step in life: starting my career and job. It’ll be crazy not to have homework and tests to study for every night! I’m really looking forward to being able to hone my data skills full time instead of on the side soon.
Tableau Public
Link: https://public.tableau.com/profile/maria.brock#!/?newProfile=&activeTab=0


Thank You for sharing such wonderful and informative stuff.
Tableau Consulting services in Saudi Arabia
Tableau Consulting solutions in Saudi Arabia
Loved this interview with Maria Brock.
If you’re looking to elevate your Tableau journey, Helical IT Solutions offers expert Tableau consulting services to support your data goals.