

Ivett Kovács Bio
As a senior data visualization developer and designer at Starschema, Ivett has helped some of the most well known companies use data to make more effective decisions, solve tough problems and increase effectiveness.
Ivett has a gift for taking complex data and making it accessible and understandable by developing creative, informative and functional visualizations.
For Ivett, dataviz is both a job and a hobby. She’s taught numerous Tableau and data visualization best practice courses and workshops at universities and organizations. She believes, that Data and design can save the world.
Data and design can save the world.
Ivett Kovács
Give her data and a challenge, and she will give you back something beautiful and effective.
Blog: http://dataviz.love/
Tableau Public Profile: https://public.tableau.com/ko-kr/s/profile/yvette#!/
QUESTIONS

Link: https://public.tableau.com/profile/yvette#!/vizhome/Unicef-Uprooted/Uprooted
Michael: Hello Ivett. Your featured dataviz on Tableau Public, Uprooted: The growing crisis for refugee and migrant children, is a very important topic. I have two questions for you related to this dataviz.
First, can you tell my readers your process for developing this dataviz? For example, how did you decide on this topic, find and gather the data, design and then develop the data viz in Tableau?
Ivett: I joined the #VizForSocialGood non-profit data viz project as a volunteer in 2017. ‘Viz for social good’ is a platform for data visualization enthusiasts who are focusing on a social problem solving by their informative visualizations. You can find more information about it: https://www.vizforsocialgood.com/how-it-works/
‘Viz for social good’ is a platform for data visualization enthusiasts who are focusing on a social problem solving by their informative visualizations.
The data was given by UNICEF and communication goal was to call attention to this topic through visualizations.
From a technical standpoint, making the map was the biggest challenge. I wanted to use curved lines to emphasize how far these children had to travel from their home. Today, it is easy to create a similar atlas with only 2 functions in Tableau, but a few years ago it took a lot more time to draw curved lines.
To introduce the scale of the problem and frame the report, I used BANs (Big-Ass Numbers) that provided context and key information — like 50 million children have migrated across borders. This is shocking information expressed as a single number.
I used the UNICEF’s signature cyan blue hroughout the whole visualization.
This blue color is designed to create an immediate connection with the viewer. I also selected some secondary colors from UNICEF’s offical color palette to call attention to the regional distribution (bubble chart on the left side)
I used photos that reflect the emotional world of the theme.
All in all, I made a visualization to reinforce the brand identity and tell an important story connected to the brand. In this way, the visual and the story it tells work together seamlessly to raise both issue and brand awareness. I am honored that UNICEF used this visualization in its campaign. For this reason, and because of the importance of the issue this visualization represents, I chose it as the feature visualization on by Public Gallery. If this is how I can help and raise awareness of the topic, then it is well worth the work.
Michael: Second, why is the plight of refugee and migrant children so important and what can the #datafam do to help?
Ivett: If we help this generation of migrants, and these children have chance to learn and develop their skills, they will be able to contribute positively to society. If they don’t have opportunity for education and a normal childhood they will both experience terrible hardship and also won’t be able to be a source of economic progress. This is the future of the world. It’s our choice.
As data visualization developers and designers, we can use the power of visualization to raise awareness about a worldwide problem. I think we are an important between organizations and people because — done correctly — visual communication is a language that everyone can understand. I encourage you, if you can, please take part in similar project. See what’s next with Viz for Social Good and sign up you too!
Michael: You are a Senior Dashboard Designer with StarSchema Ltd. Can you tell my readers a little bit about how you use Tableau at work?
Ivett: We have a long-standing history of excellence, helping some of the world biggest and most innovated companies use there data to make better business decisions, build smarter products, and deliver more value for their customers, employees and investors. At Starschema, we dig into our customers toughest business problems, design solutions and build the technology needed to compete and profit in a data-driven world.
I have been with Starschema from the very beginning and extremely lucky to be able to work closely with Tableau Zen Master, Tamás Földi. When I started
I wasn’t fully aware of the ‘ins and outs’ of data visualization. It was a challenge to learn these skills, Tableau and BI world itself. I’ve always love art and design. Working in this profession is like a dream for me because I can mix the creativity with math and make things that can make our world a better place.
My work supports clients in their technical data needs and solve business problems. Through proper analysis of the data problem, I build dashboards that visualize information in ways that help reveal insights that were hidden in their data. I work on a broad range of different types of projects — something different almost every month. This keeps things really interesting. I really love the visual preparation and design of the reports.
When teaching Tableau and BI related courses at Universities, I always look forward to the last lesson when my students present their first self-produced report. It shows that weeks of hard work yields improvements. Seeing their sense of satisfaction, is the best, most rewarding feeling.
Michael: Can you tell me three of your favorite Tableau Desktop tips and tricks?
Ivett: I know everyone is completely enamored with the animation feature. Thus I might surprise you because my favorite tips and tricks are comparatively easy and basic. That’s why I love them. Simplicity is beautiful and small things can make a huge difference.
Custom colors. I love that we can create and use our client’s own color palettes by modifying the Preferences.tps file. Why? Because color is an essential part of any brand identity, so it is important to use what people already know and associate with the brand or with an emotion. Inconsistency will confuse and alienate your customers.
That’s why my second favorite trick is about custom fonts. Larger companies not only have their own color palette but also use custom fonts in their visual communications. Using a new font family that Tableau does not contain is tricky because it has to be installed on both your Desktop and on the server as well.
If you’re working in a computer that doesn’t have this new font and you need to publish a Tableau report to the server immediately or you don’t have the right to install anything on that machine, it’s no longer a problem. As long as the font is on the server itself, just type the font name on the Format Workbook menu and publish the workbook to the server and you/your client will see that specific font in your report on that Tableau Server. Thanks for this tip to Rodrigo Calloni.
Since I mentioned the Format Workbook menu I’d like to make that tip #3. Format Workbook is really useful when you build a massive workbook and don’t want to have to set the same formatting — like fonts, alignment, borders an lines lines on each individual sheet. You can use this Format Workbook menu and set them up all at once. It will save you a lot of time.
Michael: You were born in Hungary. Can you tell my readers what makes Hungary so special?
Ivett: Yes, I am 100% Hungarian. Most of the people think that I am Italian but no J
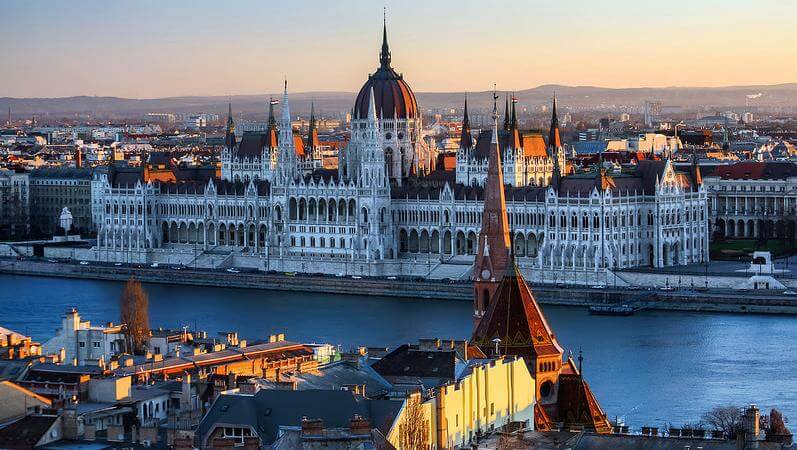
The country is well known for its talented people, thermal baths and rich culture. Everywhere you go in Hungary, you will see old and beautiful architecture. In Budapest, you can walk around a whole day, just looking at old buildings and still only scratched the surface. If you like to party with people from all over the world, you should visit Hungary when Sziget Festival — a huge outdoor music festival held on an island in the middle of the Danube — is happening.
If you are wine lover you’ll find plenty to enjoy from Hungary’s seven main wine growing regions. My favorite is the Balaton region. You can read more about the Hungarian wines in this cool book on wine that uses sleek data visualization https://winefolly.com/review/hungarian-wines-for-the-win/
If you want to visit, let me know, I will guide you J. Don’t worry while prices have increased in Budapest in recent years, it’s still very affordable to visit Hungary.
Michael: You are a Tableau Public Ambassador. Can you tell my readers how you achieved this honor?
Ivett: It’s a great honor to be recognized as a Tableau ambassador in 2016. I believe my community work was the key to being recognizes and honored in this way. I really try to help people, motivate them on their Tableau’s journey and inspire them through my visualizations. This is a big responsibility to share my knowledge so that more people use and really enjoy using Tableau. I get a lot of encouragement and help from the community and I try to give it back.
Thank you for being a part of this wonderful Tableau Community! It matters a lot to me.
Michael: What do you feel is missing from Tableau Desktop? What features would be on your wish list to see added to the application?
Ivett: I really miss frames with rounded corners. Just open an application on your mobile, see icons on your laptop or on the web browser, the world is not using sharp corners anymore. This is not a new fashion wave, rounded corners can make information easier to process. So I really want to see this available in Tableau.
For Tableau Public, it would be great to have more fonts available on the web.
Michael: What were your three favorite things you attended or did at #TC19?
Ivett: My favorite things had started before TC19. I had a chance to work together with Klaus Shulte, who is Zen Master and IronViz winner from Germany. We had a presentation where we revealed tricks behind our custom visualizations. I will never forget this experience that I could share my work live there on the stage for my DataFam! I absolutely love meeting other amazing Tableau Rockstars from the community in person and can’t wait for each Tableau conference to come around.
Michael: What is next on your “To Do” list? What can the Tableau community expect to see from you in the near future?
Ivett: I have been working on my next big project which will be much more than a data visualization, but I can’t talk about it yet. Everything will soon be revealed. Stay tuned.
I am so honored to be involved in the team of 2020 #WorkoutWednesday. Technically, this is the greatest honor I can get.
Tableau Public
Link: https://public.tableau.com/profile/yvette#!/

