Sara Hamdoun Bio
Consulting Analyst at The Information Lab UK.
Sara joined The Information Lab from an entrepreneurial background, having started her first business at a young age and later graduated with a Business Enterprise degree. It was through her own business experience and working with other organisations, that she discovered the power and importance of analyzing and understanding data. Keen to learn more, Sara attended a Meet & Greet event hosted by The Data School where she discovered the infinite possibilities of what Tableau and Alteryx can achieve. She was encouraged and inspired by The Information Lab’s ethos and knew this was a perfect place to pursue a career in data analytics.
Fuad Ahmed Bio
Data Analytics Consultant at The Information Lab UK.
Fuad developed his curiosity for technology and computing through video games. Realizing the importance of technology and data in the modern world he decided to pursue a path in data analytics. Fuad completed the 4 months training at the Data School in Tableau and Alteryx and is now consulting for different clients under The Information Lab.
In his spare time, he loves to play sports, something that brings out his competitive side, and having played more than 6 years at Essex County Cricket Club he has developed a progressive mindset and is always striving to improve.
QUESTIONS
Link to data viz:
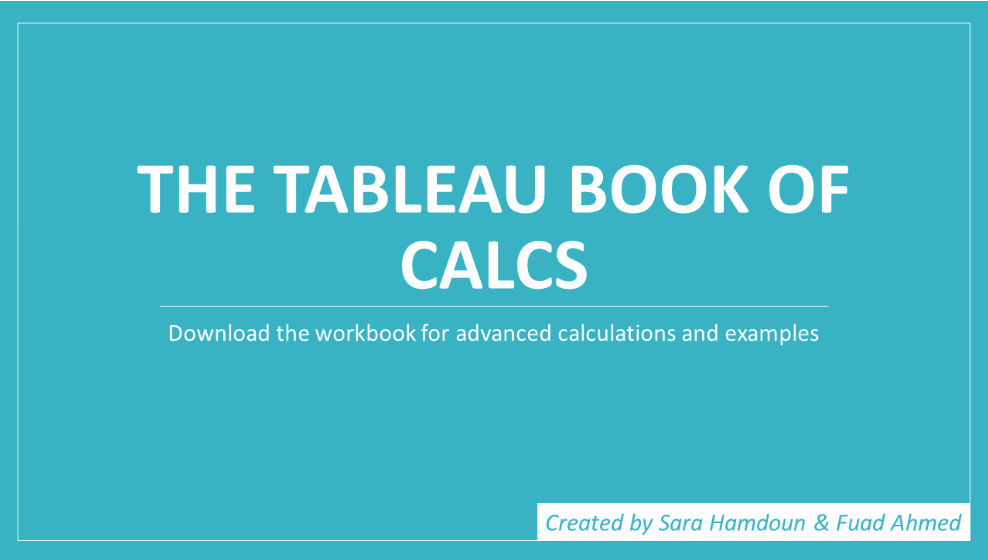
Michael: Hello Sara and Fuad. You recently published to Tableau Public, The Tableau Book of Calcs. It includes 25 examples of how to use Tableau calculations in your data vizzes.
You did a great job creating this and I think it will be very helpful for Tableau users from beginners to experienced users.
Can you talk a bit about your motivation for creating this workbook, why you chose the examples you did, and how this will benefit the Tableau community?
Sara and Fuad: The examples we chose were based around common questions asked by clients/ colleagues or those that we believed provided good analytical analysis. Originally, we would both document common calculations that we’d come across from training and throughout placements on a Word document. A lot of these calculations would include business use cases. It looked something like this.
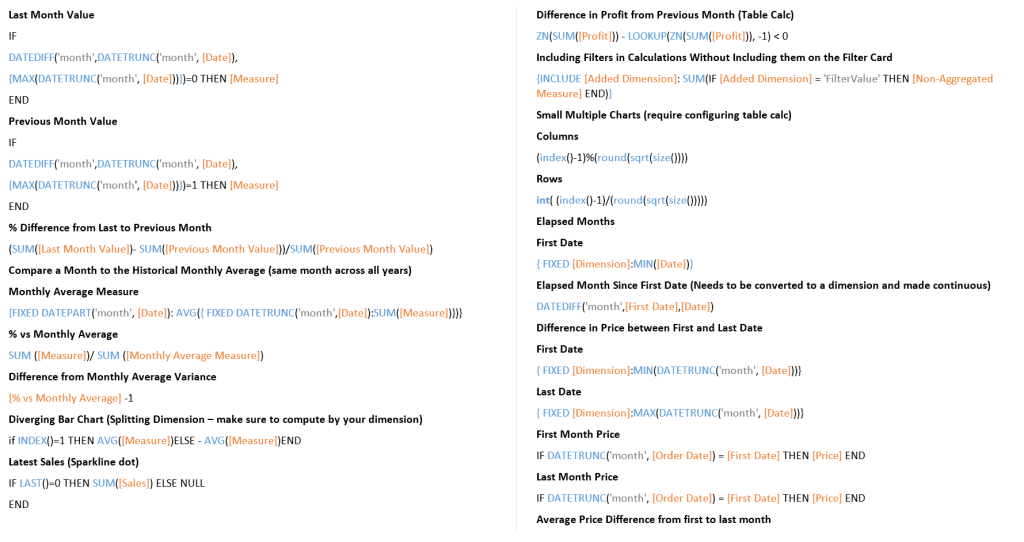
We then realized that there wasn’t a conclusive resource that covered calculations across a wide range of topics. Using the Word document, we decided to create a workbook that had a step by step guide, as well as examples to make it more engaging and interactive.
We believe ‘The Tableau Book of Calcs’ will aid the community, as it will save valuable time, as it’s a one-stop-shop for calculations rather than searching through multiple sources. It also allows both beginners and regular Tableau users to back-track and re-create the chart more easily, which can then be easily adapted to different scenarios. Overall, creating the workbook was a great learning experience, whereby we were able to share our knowledge and expertise.
Michael: You both work for The Information Lab UK. Can you talk a bit about what you do in your position there?
Sara and Fuad: The Information Lab is involved in all aspects of data analytics, from provision of your first Tableau and Alteryx license to helping you roll it out across the entire organisation. We both joined The Information Lab through the Data School; this is a great program that has fast-tracked our learning and would highly recommend applying for anyone that wants to go down this career path. The initial training is 4 months, led by 2 head coaches Andy Kriebel (Tableau Zen Master) and Carl Allchin. Throughout the training, you learn a great balance of hard and soft skills. For instance, presenting, structuring client meetings and effectively visualizing data. Once the training is completed, we have four 6-month placements in various industries. Our role with clients is to help them become more self-serving via problem-solving, creating insights and implementing best practices.
The great thing about The Information Lab is that there are so many opportunities to learn and grow and the people within the company are incredibly talented. The Information Lab encourages transparency, collaboration, and continuous education. This creates a great atmosphere and a wealth of knowledge that is literally in the palm of your hands.
The Information Lab: https://www.theinformationlab.co.uk
Data School Application: https://www.thedataschool.co.uk/apply
Michael: Can each of you tell me three of your favorite Tableau Desktop tips and tricks?
Sara and Fuad:
- Duplicate as cross-tab – Select the worksheet and right-click duplicate as cross-tab. This effective feature allows us to verify figures and aids comprehension when understanding what’s happening behind the visualization.
- Format workbook – Select format on the top pane, then select workbook. This option increases consistency and it avoids repeating formatting and those annoying grid lines, which again saves time.
- Create folders, colour worksheet tabs, comment on calculations and copying worksheets across workbooks. Although this may seem like a really basic tip, it’s super helpful when structuring your workbook. It also aids comprehension, which helps with handovers.
- Formatting positive or negative numbers using arrows – Sara Hamdoun has written a blog post on how to add ‘+/-’ OR ‘▲/▼’ to labels/ BANS.
- Replace references – This allows you to replace old fields with new ones in just a few clicks. Laine Caruzca has written a blog to explain this in more detail. Link below. https://www.thedataschool.co.uk/laine-caruzca/tableau-top-tip-replacing-old-fields-with-new-ones-in-just-a-few-clicks/
- Show relevant values on a filter – The concept is hierarchical in nature and acts as a cascading filter. It avoids confusion and creates a better user experience.

Michael: It has been a while since I have been to London and most of the time, that has been waiting around the airport. If I were to come to London on vacation, what is the main place you recommend I visit?
Sara and Fuad: It’s hard to only recommend one place, as London has so much to offer and it depends on what you enjoy doing. However, we think most people would agree that London can be busy and chaotic, so it’s nice to relax and breath in some fresh air at one of the many great parks in London. We’d recommend Regent’s Park specifically, as it has a great atmosphere and some amazing scenery. Also, if you get bored there’s London Zoo just around the corner.
Michael: What do you feel is missing from Tableau Desktop? What features would be on your wish list to see added to the application?
Sara and Fuad:
There’s a couple that we would like to see:
- Snapping sheets in dashboards – Currently, creating layouts in dashboards can be painful at times; especially if you’re new to the tool. We hope that Tableau introduces a similar feature to PowerPoint where everything is much easier to align and snap things in to place, this would save so much time.
- Support all fonts and text formatting on Tableau Public – You see a lot of people going through the effort of using images on their dashboards for customs fonts and different text designs, which isn’t ideal.
- Open more than one calculated field at the same time + open a calculation within a calculation and be able to edit then save it – This would be super useful, especially as a lot of calculations in Tableau involve nested calculations.
- Spell check is one I think everyone wants to see.
Michael: What is next on your “To Do” list? What can the Tableau community expect to see from you in the near future?
Sara and Fuad: In terms of ‘The Tableau Book of Calcs’ we plan to update and maintain the workbook with additional examples, as well as improve the user experience.
Personally, we’re always trying to learn new and develop existing skillsets. Adding to our certifications and passing the desktop specialist exam is probably the next thing we’d like to do. Other than that, it would be good to attend more networking events to gain and share knowledge with the rest of the community.
Tableau Public
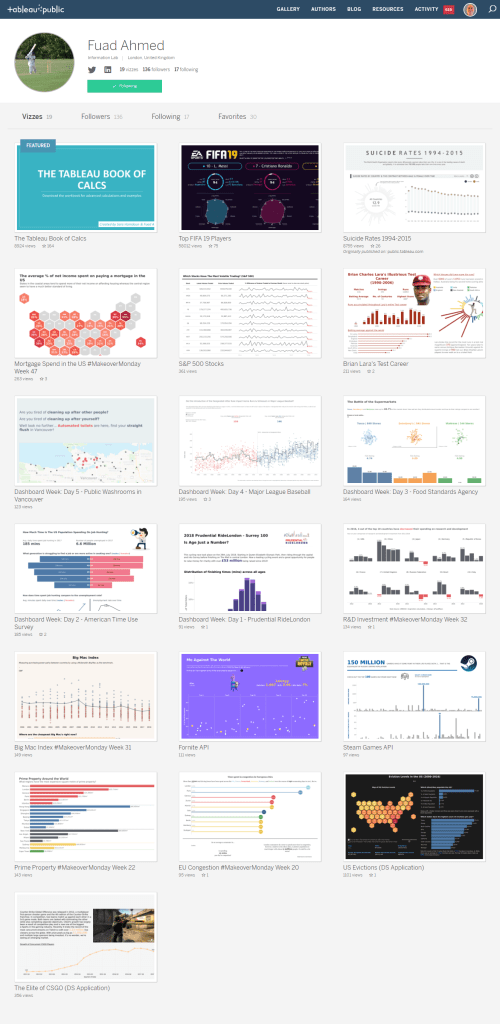
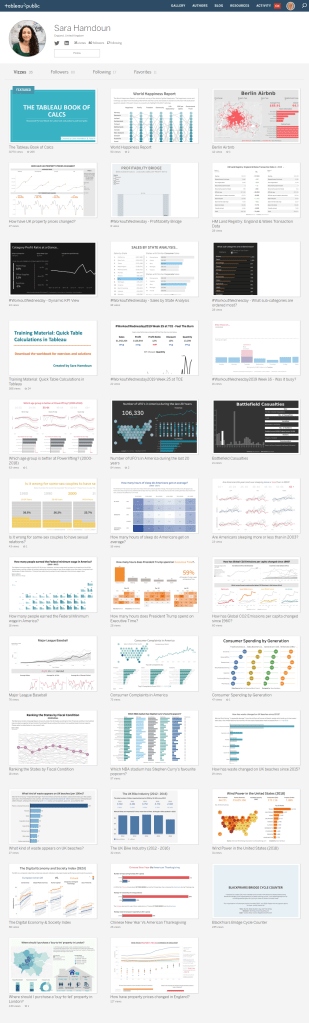
Sara’s Link: https://public.tableau.com/profile/sara.hamdoun4060#!/
Fuad’s Link: https://public.tableau.com/profile/fuadahmed#!/