Katie Fontenot Wagner Bio
Besides being a proud Cajun and a lover of puzzles, I can typically be found exploring the country and evangelizing Tableau. Data has enabled me to piece together solutions through visualizations. My passion is enabling talented individuals to pursue advancement of skills and encourage growth within their organizations. I dream of fun, everyday occurrences that should be beautiful visualizations.
QUESTIONS
Link to full viz:
https://public.tableau.com/views/LagniappeFromLocalsTC18_Draft/LagniappefromLocals?:showVizHome=no
Michael: Hello Katie. I was admiring your data visualization that you created for guests at TC18 in New Orleans. Can you tell my readers about your process to harvest the data, design, and then create this dataviz in Tableau?
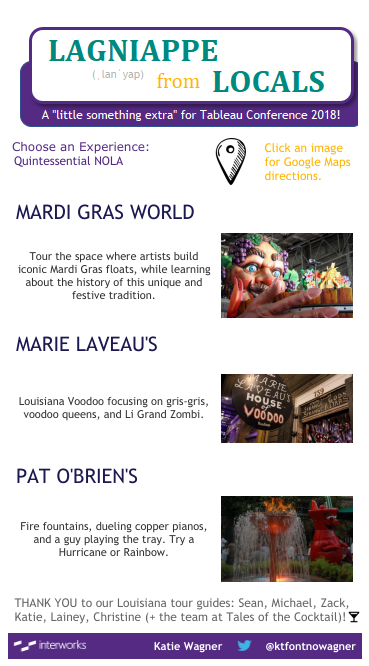
Katie: Hey Michael – thanks for the invitation to be here with you! I had so much fun building the NOLA viz. As soon as I heard the location announcement, my #1 goal was to ensure our #datafam loved Louisiana as much as I do. I knew that everyone would use sites like Google, Yelp, etc. for recommendations, so I wanted to give the audience a unique experience. I contacted a few friends who’ve lived in or heavily visited NOLA to create the list. I took ONLY local recommendations, thinking about the different travel vibes of our diverse community. I knew not everyone would be interested in drinking until 3:00 am, so I wanted to be sure to include things like coffee shops and live music. Having attended four conferences, I know that most people don’t lug around heavy laptops, so ensuring the viz was mobile friendly was another high priority.
My design process always starts with big ideas – getting them to paper is a totally different challenge! I sketched a few ideas and brainstormed with colleagues at InterWorks. The quality of the viz was certainly enhanced by assistance from creative minds along the way. A friend suggested finding a color scheme that represented my vision of New Orleans. I tested a few, but decided to stick with a palette close to the local minor league baseball team, the Baby Cakes.
I iterated SO. MANY. TIMES. My vision went from a long, scrolling dashboard to the short, parameterized version you see today. I built different borders/images and published what felt like 100 copies to Public. As with many of my viz projects, the deadline approached and I decided to go with my friend Vince’s quote: “Done is better than perfect”. I’m really pleased with the final viz, and I think many people continue to receive value from it. Alteryx Inspire 2020 is headed to NOLA, so I hope even more people find it entertaining and helpful.
Michael: You are an HR Data Analytics Specialist with CBRE. Can you talk a bit about how you help clients with their data analytics needs using Tableau?
Katie: I’ve been in my position with CBRE for only a few weeks now, but am already loving the opportunity to make an impact with employees of the company. Our Workforce Analytics team focuses on metrics like promotions, diversity, compensation, benefits: all components that are critical to employee engagement and happiness. With 100,000 employees globally, we’ve got quite a population to analyze! I find this position very relatable with others in the Tableau Community, as almost every organization has a Human Resources team. I’m really looking forward to joining user groups, participating in training, and meeting more people in this space.
Michael: Previously, you were a Training Lead teaching Tableau. I have taught several internal Tableau Desktop classes from the beginners level to the Jedi level, and only now starting to feel more comfortable teaching Tableau concepts to others. Can you provide some recommendations to those who will be training others within their organizations on how to teach Tableau to others?
Katie: Absolutely! I value the experience I’ve received as an accredited Tableau trainer because it motivated me to invent creative explanations, solidifying my knowledge of the content. I’ve carried that part of my role over to CBRE, and will be responsible for training our Workforce Analytics team in Desktop. Here are a few suggestions:
1. KNOW THEIR MOTIVATION – Our team set a goal to be certified by the end of the year, so I’ll include a breadth of topics to ensure we’re covering all components of the tool. If your team is already familiar with Tableau, your time may be better spent reviewing challenging calculations, company style standards, or tackling common pitfalls you’ve experienced.
2. INCORPORATE THEIR STRENGTHS – If at all possible, keep the group size small and ask the individuals HOW they prefer to consume the information. Many of us have been through years of academic education and have identified whether we want to see/hear/do. Tailoring the teaching style to multiple learning styles typically yields stronger results. I try to remember that “if someone doesn’t understand what I’m saying, it’s usually my fault first”. Meaning…a learner isn’t unintelligent if they can’t grasp what I’m teaching – they probably just need to hear/see/do it again or in a different way.
3. KEEP IT RELEVANT – As adults, we recognize the value of our time. As children, we were just forced to be in the class. If someone is ignoring my instruction, they either genuinely don’t need the info. or don’t understand the importance of its application. It’s my job to allow them to take some space, or to continue iterating on my explanation. Additionally – be prepared! If participants are dedicating time to learn from you, be courteous and develop a talk track, lesson goals, or practice questions ahead of time.
4. ELEVATE YOUR ENERGY – I truly feel instructors MUST be the most excited person in the room at all times. Even if you’re tired. Even if you’re hungover. Even if you have the flu. If the instructor is low energy, the class will be low energy. Challenge yourself. Remind yourself how the tool enhanced your own career, and try to radiate that positivity.
Michael: Can you tell me three of your favourite Tableau Desktop tips and tricks?
Katie:
- Right-click + drag (on macOS, left-click+Option+drag) fields, especially Dimensions, has saved me a ton of time!
- I appreciate the ability to adjust the height, width, x, and y placement of floating objects on dashboards.
- Copy/paste data from the web, Excel, etc. straight into a Tableau workbooks for a quick prototype of your solution.
Michael: I saw on LinkedIn that you are a Tableau Desktop Certified Professional. As someone who is currently prepping to take this exam, can you provide recommendations to my readers on how best to prepare for this exam?
Katie: It looks like we’re in the same boat, Michael. I’ve actually registered to renew my certification this fall. I felt the intimidation factor for the Certified Professional exam came from the fact that it’s judged by a committee. My advice is to focus on the intended audience for the dashboard. Consider device size, accessibility, and tackle all low-hanging fruit. Sharing what others had passed along to me, tackle the dashboard first. In that third module, storytelling, block off only 1 hour and focus your attention on getting the main questions answered. Return to the first and second modules so you can feel confident that you’ve already completed what could be an 8+ hour project. Finally, don’t forget about tooltips! For the second module, advanced technical skills, complete as much of the problem as you can. I like to believe the exam assessors give credit for our thought processes in attempting the solution, even if it isn’t perfect.

Michael: So, like you, I went to a college in the South with its own particular lifestyle (re: Texas A&M University). Aggies have a lot of pride, tradition, and love their football. Can you discuss what makes Louisiana State University so special to you, and maybe also talk a bit about the Cajun lifestyle that is unique to Louisiana?
Katie: The Cajun atmosphere in South Louisiana is centered on family, tradition, and amazing food. Our ancestors weren’t wealthy, so they relied on heavily spiced meats and lengthy cooking times to ensure a delicious meal. It’s not uncommon to find a few people from Acadiana spending an entire Saturday cooking a “sauce”, playing cards, and drinking 10 oz. cans of domestic beer. I think many of us continue to pass along the games, phrases, and recipes of the Cajuns because we want our friends and future families to have as much fun as we always have! LSU Sports, and especially football, are just another piece of that puzzle. The campus is simply electric on game-day; it’s tough not to be excited. When The Golden Band from Tigerland marches down the hill, it brings back the exhilaration and nostalgia I’ve experience my entire life. I love that tailgating is always a nice excuse to see old friends and meet new ones. Academically and socially, LSU has given so much to me. It only feels right to share those experiences with the ones I love.
Michael: What is next on your “To Do” list? What can the Tableau community expect to see from you in the near future?
Katie: My husband and I chat frequently about our journey to Financial Independence. As we leverage Tableau in these decisions, I’m hoping to find better ways to share the information with our community. Money is always a tricky topic, but my hope is that, in sharing our story, we might motivate others to think analytically about their financial futures. In the meantime, I’ll continue creating vizzes that help in my everyday life. I’m currently tracking sitting/standing hours at my desk each day to find patterns. I’m also attending a big trip to Europe next year that lends itself quite nicely to a beautiful dashboard. My hope is that I can continue teaching, sharing with, and learning from the community that has given so much to me! I’m so honored by the opportunity you’ve provided to share my story. Thanks, Michael, and for everything you do for our community.
Tableau Public
Link: https://public.tableau.com/profile/ktfontnowagner#!/