Vince Baumel Bio
Vince Baumel is a Consultant at Daugherty Business Solutions. Vince noted,
I bring a strong background of academia and industry experience to my career in data research and visualization. I thrive on helping people find meaning in their data and communicate their findings, and I am meticulous about my own work and how it’s presented. I’ve brought a more agile mindset to a traditionally static waterfall work environment, and fostered a new communication paradigm that allows various user teams to interact independently.
In my career I’ve tackled many different aspects of data administration and management, and always enjoy the opportunity to communicate effectively with data. It’s an honor to be able to share the passion and enthusiasm I have for this industry with so many people!
QUESTIONS
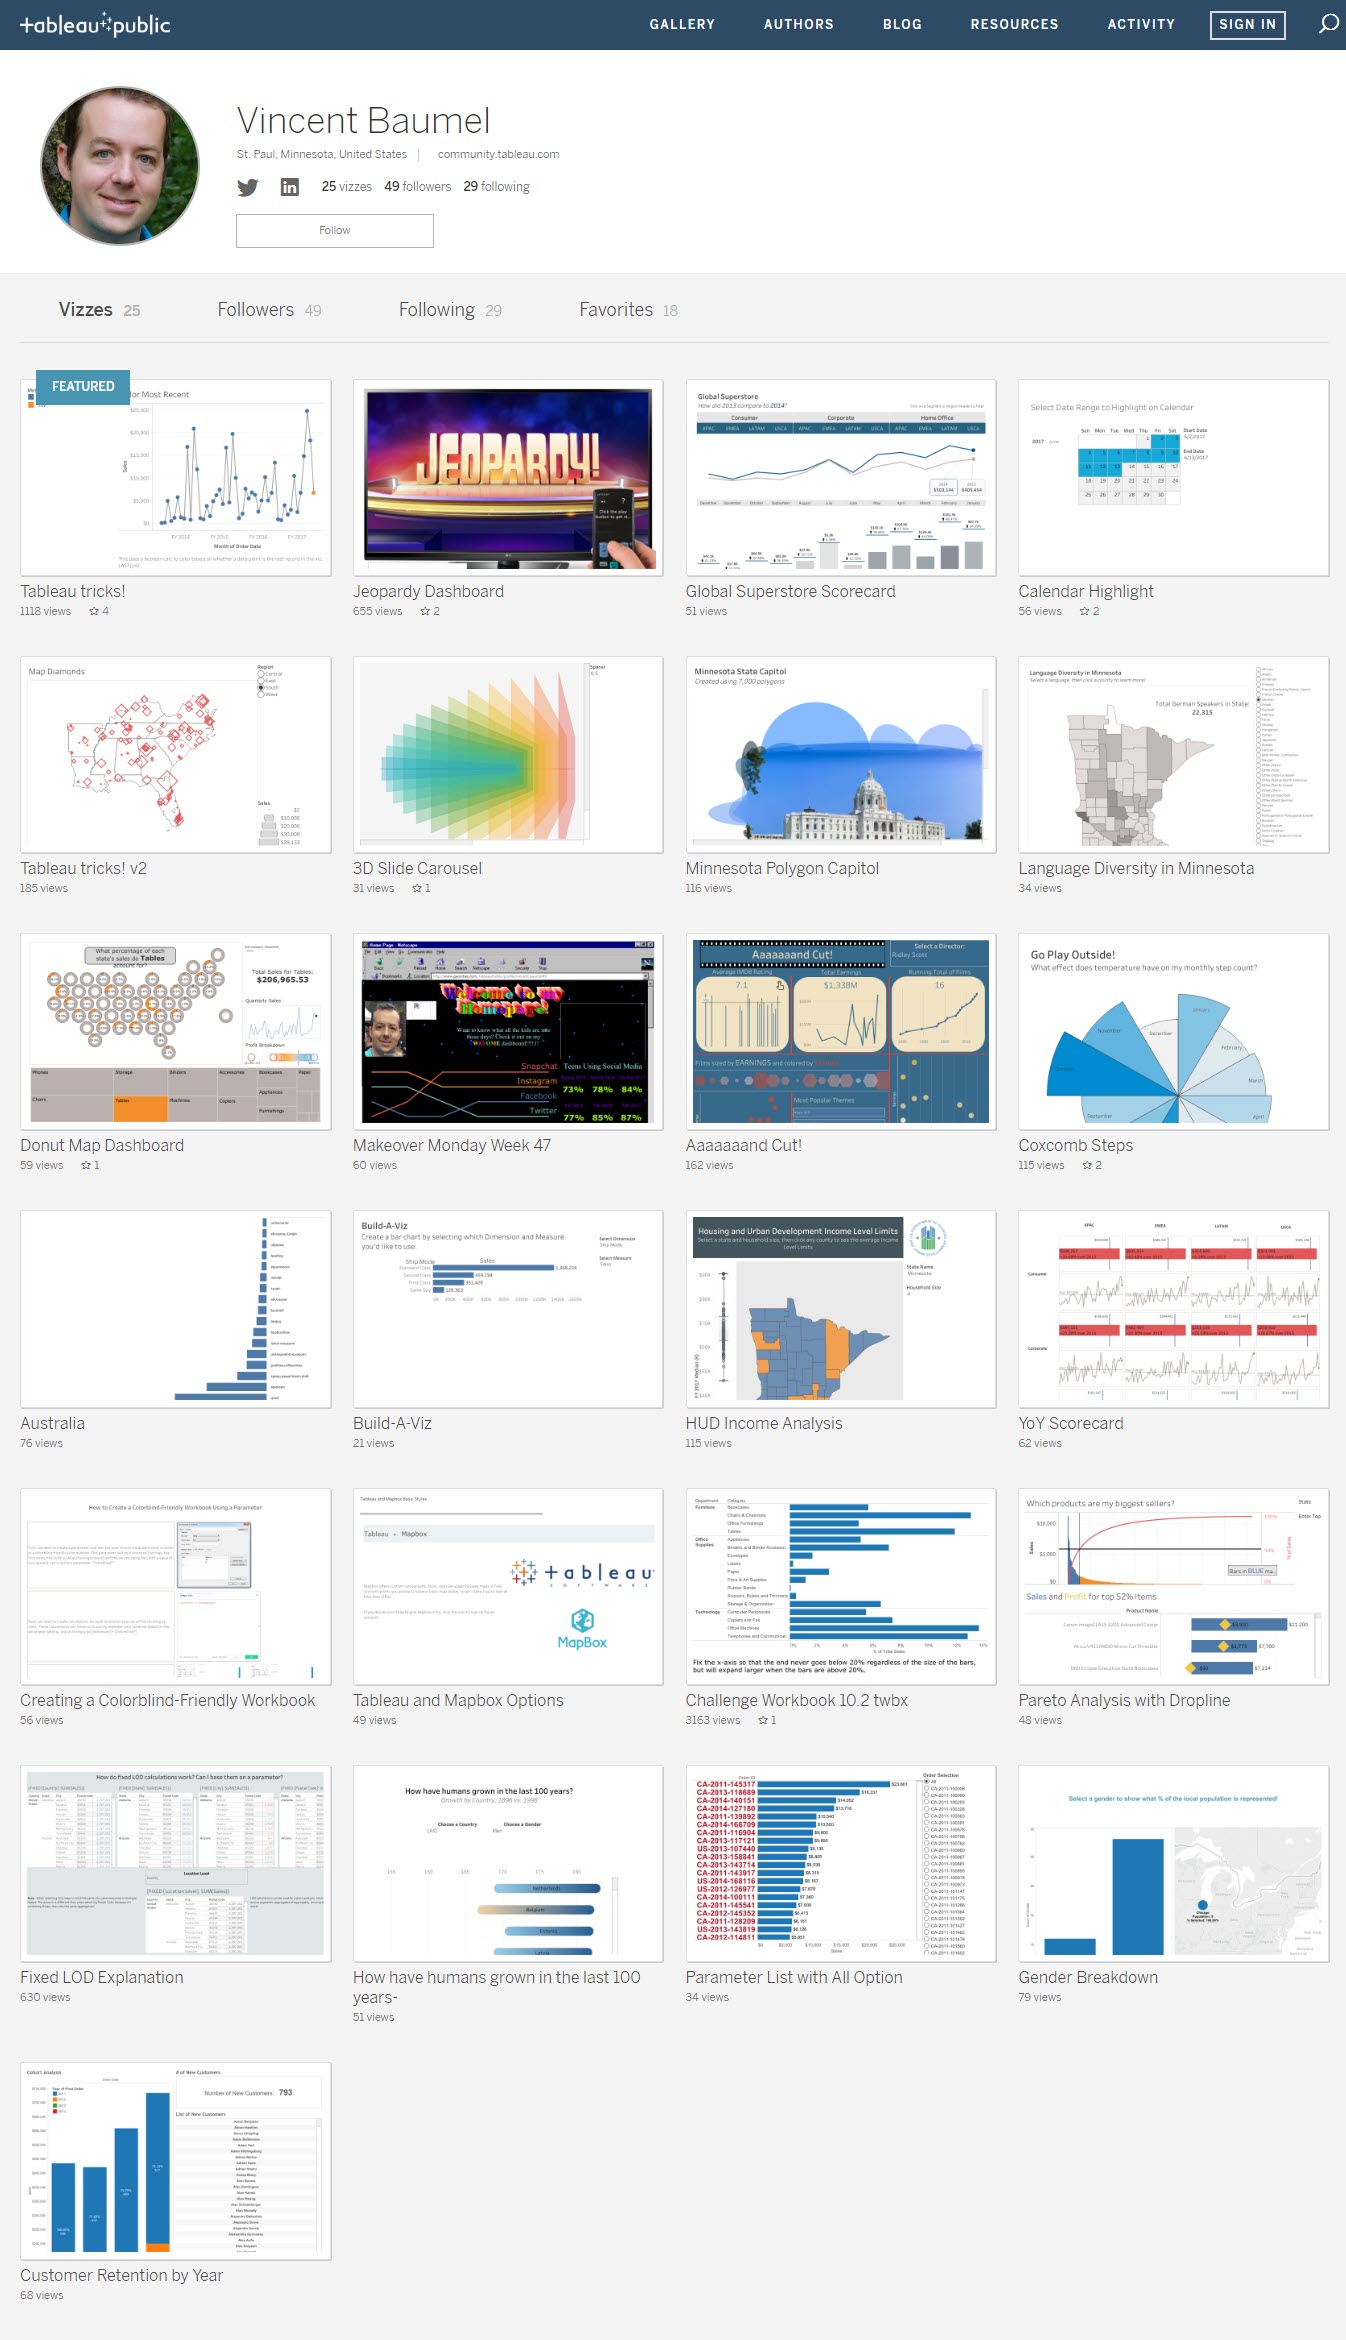
Michael: Hello Vince. I really liked your Tableau tricks! workbook that you posted on Tableau Public. It is a real potpourri of a wide range of tricks that can help you in developing your Tableau data visualizations. Can you tell my readers what motivated you to create this workbook and how it can help others in the Tableau community?
Link: https://public.tableau.com/profile/quantum.relic#!/vizhome/Portfolio_20/ColorMostRecent
Vince: Early in my career I was trying to find an effective way of cataloging all the little tips and techniques I came across. These ideas came from all sorts of different places – blog posts, books, Tableau help forums, Twitter posts, Reddit, LinkedIn, etc. Many of the ideas were ones I came up with as well – either directly work related, or sometimes just playing around and seeing what I could do. I realized one day that I had about 20 different workbooks containing just a single worksheet or dashboard, all using Superstore to demonstrate one thing or another. So I decided to consolidate them all into a single workbook – a journal of sorts, that could serve as both a single point of reference as well as a snapshot of where my skills were at the time. Some of the techniques have been made obsolete as new features have been added to Tableau, but it’s been a really helpful habit that has come in handy time and time again!

One of the techniques I liked the most from that first Tricks workbook was born out of a conversation I had about stacked area charts. We were discussing how it was only reliable in showing the growth of ONE dimension over time; the dimension grounded on the axis itself. I had just learned about hover actions in a worksheet, so I built a stacked area chart that showed a %-of-total breakdown per dimension for the x-axis time you were hovering over. It solved the problem in a really cool way!

Michael: On your Quantum Relic blog, you had a post where you say, “Done is Better Than Perfect.” If I may, I would like to quote a snippet of your post.
“Nothing you create will ever be perfect, and this is a good thing. Do not seek to outdo yourself with every iteration of every idea that comes to your mind, because you will burn out before you ever arrive at a product you consider “perfect”. This idea, this siren, is (and should be) forever out of reach. Were you to achieve it, that creativity that drives you would slow to a stop. Strive for it, certainly, but maintain a healthy fear of ever actually attaining it.”
So, I really get this. I think most people in the Tableau community are probably overachievers, Type A personalities, perfectionists or one of the Flerlage Brothers (sorry gang, I know I am stereotyping here). But, as part of our job in data analytics, we are expected to produce data visualizations that are 100% accurate in their results. How do we find a balance here?
Blog Post Link: https://quantumrelic.wordpress.com/2018/10/30/done-is-better-than-perfect/
Vince: Great question! I think that in order for us to be effective data analysts (and we’re ALL data analysts in one capacity or another) we need 3 fundamental understandings:
- What is the truth of the data?
This speaks to the accuracy you mention, and requires us to know where the data is coming from, what are the limitations of the data, what is being done to correct inaccuracies in the data, etc.
2. What is the perspective of my audience?
This goes deeper than just deciding which filters to add to a dashboard. What keeps your users up at night about their area of the business? What motivates them? Once you can answer these questions your ability to COMMUNICATE to them becomes much more effective.
3. At what point have I answered the question?
This is both the easiest and the hardest one. Sometimes all you need is a bar chart, and that’s okay. Not every visualization has to be a multidimensional correlative bi variate tile grid map (no offense to Leonard Kiefer, your tile grid maps are a thing of beauty), but every visualization should answer a question. At the end of the day a boring viz that perfectly anticipates and answers a question is still a pretty big win in my book.
My blog post is referring to that little voice in the back of our heads that is always trying to convince us that we’ve got time for just ONE more little tweak. The reality is that we can get stuck in an infinite loop of these little tweaks, and we need to recognize when that pattern is happening.
Michael: I have to ask, what is a Quantum Relic?
Vince: I’ve always wondered if someone would ask me this question, since the day I decided to use it as my Twitter handle! In truth, growing up I was the kid who always had his nose in a book. When I was in my early teens I spent a lot of time reading about philosophy and one idea that really resonated with me was that there is a core part of who we are as individuals that always remains there, deep down, and untouchable. Our interests will change, our motivations will change, our understandings of who we are will change, but there will always be this tiny part of our identity that remains the same. This quantum part of ourselves serves as a relic – a memento of what we get when we distill down all of the other changes we’ve gone through and reveal who we TRULY are underneath it all.
To sum it up, a quantum relic is…quintessence, really. Raw, undiluted truth.
One of my favorite authors is a man named Steven Pressfield, and his book, The War of Art, speaks to this idea. It’s one I definitely recommend.
Michael: You are a Consultant at Daugherty Business Solutions. Can you talk a little about how you use Tableau in your day-to-day engagements?
Vince: Tableau is an industry leading tool in large part due to its flexibility. Whether your data is a 3×5 cell table your found on Wikipedia or a server farm processing billions of rows of data, Tableau gives you the ability to see and understand things about your data that you just can’t find in other tools. In my work at Daugherty, I use Tableau to bridge the gap between rigid analytics and creative design – I love being able to use the same tool to shape and curate the data, explore and identify patterns and trends, and be able to visualize it in any way I can dream up.
There’s something to be said for how many of us spend our work days designing visualizations for work and our free time designing visualizations for ourselves and each other.
One of the reasons I pursued Daugherty as an employer is because they recognize how important it is to foster that drive outside of work. Encouraging and empowering your employees to develop their personal skills, especially in tools like Tableau, will only serve to make them more valuable to your clients.
Michael: Can you tell us three of your favorite Tableau Desktop tips and tricks?
Vince:
1: The first of these is also the simplest. I spent SO many hours trying to get my dashboards perfectly aligned (I even taped a ruler to my monitor a few times) when all I had to do was press the letter G.
2: Double clicking can do wonderful things in Tableau, but the ORDER in which you double click also makes a big difference! If you double click in the following order: Sub-Category, Profit, Sales
You’ll see that Tableau builds a text table, assuming you’re primarily interested in the subcategory breakdown.
If you double click the same fields in a different order: Sales, Profit, Sub-Category
Now Tableau assumes you’re more interested in the relationship between Sales and Profit at a sub-category granularity, so it builds a scatter plot instead!
3: I try to stay in the habit of validating my custom calculations at every step of my development. When calculations get big and complicated, it really helps to be able to drag portions of the calc onto different places in a worksheet to make sure everything checks out.


Michael: If you could magically be alone in a room with Francois Ajenstat (photo above), what would you ask him to add into Tableau?
Vince: One of the things that I think has propelled Tableau’s adoption is the freemium business model and what Tableau Public has done to facilitate data fluency. I would love to see that same approach with Tableau Prep, considering how much momentum the product has.
On a more tactical note, I’d love to see improvements in dashboard layer management. I can name several other tools off the top of my head that have very intuitive and flexible control over layers, and it certainly seems possible in a tool like Tableau.
Michael: What is next on your “To Do” list? What can the Tableau community expect to see from you in the near future?
Vince: This year I set a goal for myself to do more public speaking, both through presentations at Tableau User Groups and through my blog. I will continue to be a voice of encouragement and affirmation, and a listening ear for anyone who needs it.
Also I’m hoping to add another certification in the near future so stay tuned!
Tableau Public
Link: https://public.tableau.com/profile/quantum.relic#!/