Alicia F. Bembenek Bio
Alicia has spent her entire career teaching others and working with data. She has a PhD in social psychology and was a psychology professor and researcher before discovering her passion for the field of data visualization. Although Alicia’s roles and titles have changed over the years, her interest in both teaching and in using data to gain insights about human behavior has remained constant.
Alicia has been creating Tableau tutorials for the Evergreen Data Visualization Academy since April 2018 and also recently joined the Tessellation team in February 2019 as an Analytics Consultant and Tableau trainer. She enjoys learning new Tableau tips and tricks every day, sharing what she has learned, and connecting with others in the data visualization community.
QUESTIONS
Michael: Hello Alicia. Tell me, how did you first learn about and got interested in the field of data visualization?
Alicia: That is a story with a few twists and turns. I had been a psychology professor and researcher for a number of years. In that time I was teaching statistics, collecting and analyzing data, and creating charts for papers and presentations. But I don’t remember ever learning about data visualization specifically or being aware of design considerations.
Then I had a position helping to support a volunteer organization. I was responsible for our marketing materials and I was spending time learning about graphic design. I realized that I had a strong interest in design and a good eye for it. One day I happened to come across a list of graphic design specialties and saw those fateful words: data visualization. I was so excited to find a possible career path where I could use my skills in data and combine that with my newfound interest in design. In the fall of 2016, I took an online class with TechChange that showcased different tools for data visualization. I do remember seeing the Tableau demo in that class and making a note that I definitely wanted to explore Tableau more in the future.
I spent about six months learning on my own before taking the plunge and getting involved in the Tableau community. It was Eva Murray’s Tableau Fringe Festival talk that convinced me to start a blog, get on Twitter, and start doing #MakeoverMonday. That was May 2017. I was so nervous to post my first #MakeoverMonday viz and blog post on Twitter! But at the same time it was really exciting to take the chance and put myself and my work out there. The goal all along was to pivot into a new career in data viz. It didn’t happen overnight, but I can definitely say that #MakeoverMonday, my blog, and Twitter helped me meet more people and opened doors in my career.
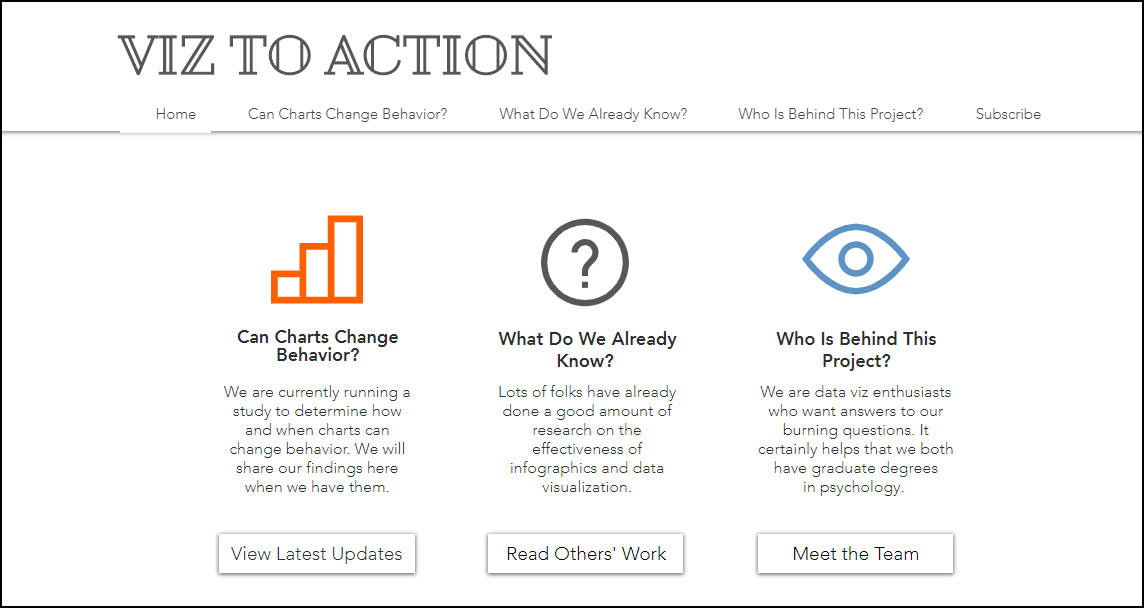
Michael: Last summer you launched your web site, https://www.viztoaction.com/. This web site is a project with Shawn M. Levin (@shawnmlevin) to understand how and when data visualization can have a greater impact.
Can you tell my readers more about this project?
Alicia: The general idea of this project developed pretty quickly after first learned about data viz. I am a social psychologist by training, which means that I am interested in understanding how our thoughts, feelings, and behaviors are influenced by others.
Data visualization is used to communicate and persuade. I was curious whether anyone had empirically studied how and when data viz can influence people. Do we change our beliefs after viewing data viz? Can charts change our behavior? Turns out that those questions still need to be studied. I found that there’s very little research on whether our attitudes are changed by data viz, and there was no research that I could find that studied whether viewing information in a data viz can later impact someone’s behavior. (I have since learned of a new research program currently being conducted by Melanie Herrmann at Vizzuality.)
I gave a talk for the Tableau Fringe Festival about my prediction that people would be more likely to act on the messages in our data viz if we actually give them specific instructions of what to do with the information (e.g., donate money, volunteer time, visit a website to learn more about the issue).
Shawn Levin saw my talk and also has a background in psychology. He let me know he was interested in the topic too so we decided to collaborate to create a research study to try better understand how and when data viz can have greater impact. It is an online study and we’ve been collecting data for a number of months now. We will close the study at the end of July and then report our results. We still need more participants, so if anyone reading this would like to participate the study, please click on the link I’ll share. (Go to https://bit.ly/2Ighszg.) I will post updates and results on the viztoaction.com website.

Michael: Previously, Mike Cisneros and you gave a talk at #TC18 titled The Benefits of Finding (and Being) a Tableau Mentor. Can you talk a bit about how we can become a Tableau mentor?
Link: https://www.youtube.com/watch?time_continue=1&v=T7uHZRKX9xA
Alicia: One good resource for making your mentoring interest known is Mark Bradbourne’s MentoringMeetup.com site. I really do think it is up to the mentee to reach out to the potential mentor though, so, as a hopeful mentor, finding other ways to be visible in the community could also be helpful. I reached out to Mike to be my mentor for a few reasons. 1) The work he was creating was both well designed and technically advanced, and 2) I enjoyed reading his blog posts and learning his perspective.
At the time I was not working with anyone else in the data viz field, so I couldn’t reach out to a colleague for mentorship. But if you are at an organization with other data viz folks, maybe consider setting up a mentoring program.
I believe that the mentor and the mentee should take time for a “get-to-know-you” meeting before agreeing to the commitment of mentorship. For various reasons, not everyone is going to be a good fit. I outline some considerations in my blog post, How to Find a Tableau Mentor.
Michael: In the past, I have interviewed Luke Stanke and Spencer Baucke from Tessellation. Can you tell my readers how you use Tableau in your customer engagements at Tessellation?
Alicia: I am an Analytics Consultant and I lead Tableau training’s and support backlog development. I really enjoy it. I love learning new skills and sharing tips and tricks with others. I appreciate that my role is not just teaching which buttons to push. We are emphasizing effective design, the importance of soliciting feedback, and the process of iteration.
Michael: Can you tell us some of your favorite Tableau Desktop tips and tricks?
Alicia: One trick that has really helped me recently was being able to pivot the data right in the data source. I was working with a client last week who had all of her months listed across different columns. I showed her how she could select those columns, select pivot, and quickly have the correct format of tall versus wide data. When she saw that it worked, and that it was so easy to do, she literally said, “Woah! Sick!” It cracked me up!
Michael: What is next on your “To Do” list? What can the Tableau community expect to see from you in the near future?
Alicia: I’ve got so many things on the list! The projects I’d like to focus my time on in the near future include 1) getting my Alteryx Designer Core certification and 2) submitting for the Agriculture #IronViz feeder. I’ve got a backlog list of other vizzes I’d like to create too so, if all goes well, I’ll be sharing those in the months ahead.
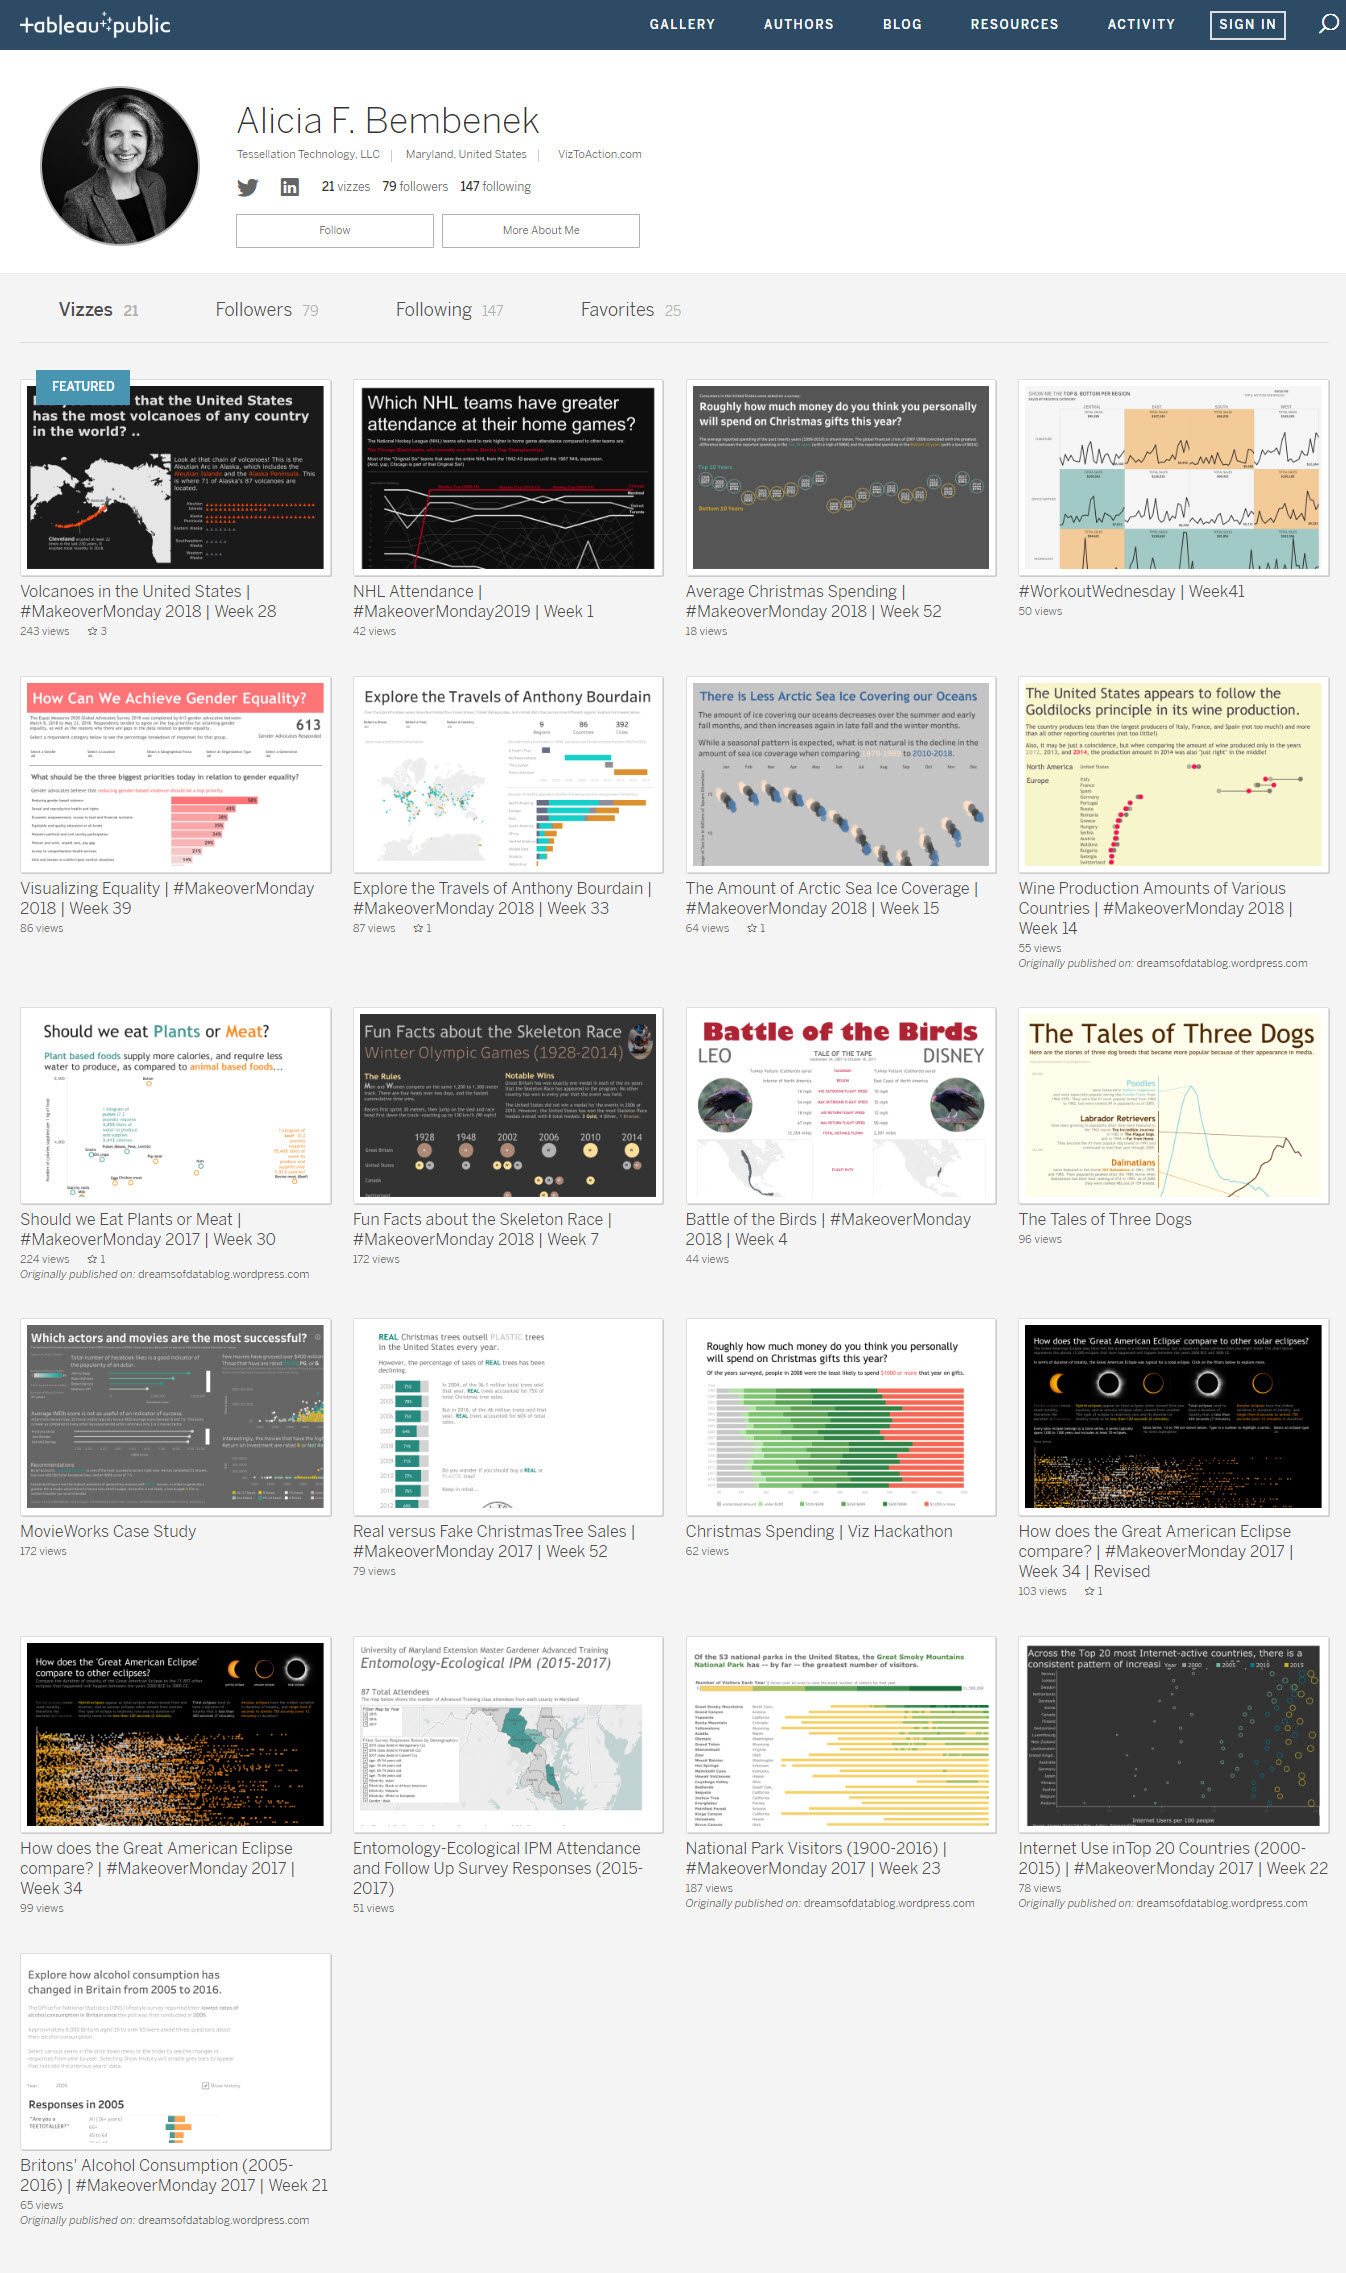
Tableau Public
Link: https://public.tableau.com/profile/dreamsofdata#!/