Christina P. Gorga Bio
Christina P. Gorga is a Lead Data Visualization Designer at Booz Allen Hamilton.
Christina came from a cognitive science academic training which meandered to roles in program evaluation and data analysis for federal and nonprofit education clients, helping them unlock their data into actionable reports. Prior to joining Booz Allen Hamilton, she was a data visualization consultant at the Lewin Group, cutting her teeth in healthcare data analytics and designing Tableau dashboards for the Department of Veteran Affairs, Centers for Medicare and Medicaid, and state clients.
Her other career passions are mentoring other women in data, gathering inspiration from art and urban design, and creating inclusive environments in tech where all can thrive.
Outside of work, she loves playing with her dachshund-beagle mix, Dolley Madison, all things science fiction, gastronomy, and exploring art museums.
Last August, Christina was selected as the inaugural winner of the Tableau Founders Award.
QUESTIONS
Michael: Hello Christina. First off, congratulations on being the inaugral winner of the Tableau Founders Award last summer. Can you tell my readers a little about this award?

Michael Cristiani
Christina: Thank you so much, Michael. I am still very moved and humbled that I was the first individual selected to receive the award.
The award was created in honor of Michael Cristiani who was a conference and Tableau community stalwart since they began hosting annual conferences. This was when there were maybe a couple hundred attendees and people could easily mingle around lunch tables that lead to lifelong friendships. Not only was he an advocate of the tool itself, but he was also passionate about building connections across the community. Many of those introductions lead others to collaborations and even new careers.
I am among the many in the community who was personally impacted by Michael’s mentorship. From 2016 until his passing in May 2018, he was one of my project leads and for a time, my boss. I recall many memories of him staying online with me well past dinner-time to figure out some client request with some tricky conditional formatting calculations. Not only was he steadfast in his willingness to help others learn the tool inside and out, but he was also a calm and friendly voice in my work day. I still miss him and glad I can pay it forward to others because of his influence on my career.
I am really excited to see who carries the baton this year and gets to experience Tableau conference for the first time like I did. The Tableau community is truly special when you consider how big the business intelligence and data visualization space has become. There’s no way I’m missing out on Vegas in November!
Michael: In your LinkedIn profile, you state:
My passion is applying cognitive psychology and design principles to build stronger reports and data storytelling for a range of industry clients. In turn, insight from these reports can emerge into better practices for businesses and programs.
Can you talk a little on how you apply cognitive psychology to building stronger reports and data storytelling?
Christina: Before I even open Tableau on my laptop to connect to data, I consider design options that would have the most effective ease of use and interpretation. I often go back to my doctoral work in how humans encode and perceive information. What science tells us is that often keeping it simple is best for efficient encoding. Thinking critically about color use, determining length, drawing comparisons of A vs. B, and labeling will all impact your data viz “bottom line.”
As far back to the early days of psychology as a field, we must give acknowledgement of Gestalt principles to guide better design decisions. Elijah Meeks has a great “scrolly-telling” interactive piece on Gestalt principles that you can find here: https://emeeks.github.io/gestaltdataviz/section1.html
Gestalt Proximity Example

What I recommend to others is in their design stage is to share their work with others (teammates, partners, strangers, the guy that makes your latte) and ask them “Do you understand what the main finding(s) are within 10 seconds?” If their answer is no, see if you can clear out some of the noise by using color sparingly, trying a different chart, and letting go of excess clutter. Less is more when it comes to data viz. If you want to see some great examples of ‘minimalist’ visualizations, I recommend taking a look at the Makeover Monday weekly reviews blog posts.
Link: https://www.makeovermonday.co.uk/blog/
Michael: You are a Lead Data Visualization Designer at Booz Allen Hamilton.
Can you talk a little about how you use Tableau in your day-to-day engagements?
Christina: At Booz Allen Hamilton, I am placed on projects where my data visualization and Tableau experience can be used to enhance legacy reporting or guide developer teams to build new dashboards from scratch. I assess current work and where adjustments can be made. I am not always working with Tableau everyday, but I’ve come to find it’s a fantastic wire-framing and prototyping tool to play with initial designs then iterate with my teams.
One other way I have found my expertise helpful is in identifying and communicating with stakeholders throughout the dashboard creation timeline. Some clients want to be more hands-off in the design process but I have come to find it is best to get their feedback early and often. This way we can identify and adjust requirements as needed to meet the clients’ needs while also building reports that will eventually be handed off to their daily use.
Michael: Can you tell us three of your favorite Tableau Desktop tips and tricks?
Christina: Always a fun question!
- Using floating text boxes and setting pixel height to “1” to create lines and dividers in dashboards (Thanks to Adam Crahen and Pooja Gandhi at The Data Duo blog for that tip).
- Copy formatting from one worksheet to another. This has saved me so much time with formatting and getting things to look consistent across my workbooks. Of course there is always “Format Workbook” from the Format drop-down.
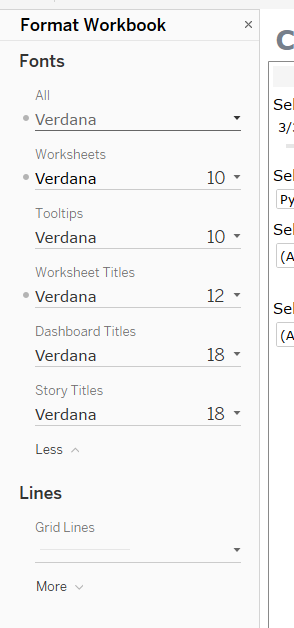
- See above.
- See above.
- Using Rank(Percentile) calculation to build quartiles and quantiles for map visualizations when you want to break out metrics into percentile buckets. Andy Kriebel’s step-by-step video is a good start on how to implement this technique. I have used this several times on client maps!
Link: http://www.vizwiz.com/2018/07/rankpercentile.html
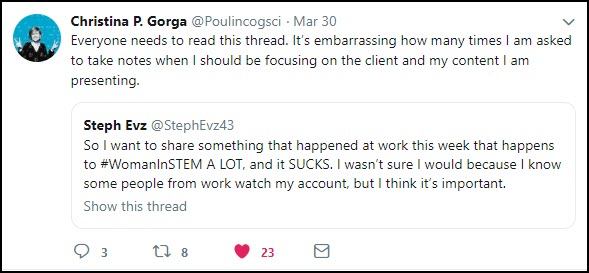
Michael: I saw your reply to Steph Evz’s tweet about her being selected to take notes for a customer meeting given she was the only woman in the room. Now, I am a guy, and can probably be as dense as the next guy about the optics of this. I realize she was on the spot as they were with a customer, and could not make an issue of it in from of the customer, but how can we get better at not doing this? Full disclosure: I take my own notes as it is how I learn and remember.
Christina: Sure, it is not a comfortable topic for any of us to talk about but it happens more frequently to women. There is a common issue with female team members getting the office housework tasks (planning work lunches, getting coffee, taking notes) that make it much more difficult for us to focus our energy on what we do best: providing value to our clients in the form of report deliverables that make a direct impact. One way this scenario can be avoided is to have a rotation of individuals who are not given a speaking role on a call or meeting to take notes so not one person is handed that responsibility every time. I recognize that there is a time and place for everyone to get handed such tasks at some point of their career, but agreeing to asks like this constantly can often lead to the detriment of moving forward on the items that matter towards promotion. Saving the world with data does not start with a Starbucks run (although sufficient caffeination is a welcome relief!).

Michael: I saw that you are a volunteer at George Washington’s Mount Vernon. One of my degrees is in History, and I specifically focused on colonial American history and revolutionary American history. I keep a mental list of the best presidents in U.S. History and George Washington always stays in the top three.
Can you tell us about your experiences at Mount Vernon?
Christina: I volunteer at Mount Vernon through a partnership with the Junior League of Washington’s placement called the Historic Alexandria Docents. We are spread across many historic properties and museums in Old Town Alexandria but I had the privilege of getting to work at the Mount Vernon property. We receive many hours of educational training even before we set foot on the estate. Because there are so many volunteers at Mount Vernon you can choose what kind of activities you want to do! I’ve often been leaning towards costumed interpretation which means I get to dress in late 1700s clothing, take on a persona, and teach others 1700s hobbies and housekeeping tasks. Other volunteering opportunities include assistance with after-hours events like the Fall Wine Festival, archaeology digs, and working in the Presidential Library.
What is so funny about all of this is that I used to visit Mount Vernon when I was in elementary school so now my life has come full-circle. Mount Vernon really is a special place and I highly encourage visitors to the DC area to take the drive down south to visit.
Michael: What is next on your “To Do” list? What can the Tableau community expect to see from you in the near future?
Christina: It’s a huge year of changes for me! I’m going to be having my first child in less than 2 weeks from writing this piece so I have to keep my goals and aspirations in check with what I can reasonably accomplish this year. Here are a couple of 2019 “To Do”s people can expect to see from me this year:
- Creating wearable data viz. I gave a #TFFNorthAm talk in December 2018 on mixing data with wearable art and have been putting together some initial conceptions of designs for accessories like scarves and clutches. I want data to be visible and conversation pieces for everyday wear, not just conference swag. More to come on this over the summer.
- Playing around with other tools with Tableau. The more I get into data visualization as a career, the more I’m interested in dabbling in other tools. One of my maternity leave goals is to learn some basic Python and start integrating Adobe Illustrator for refining Tableau dashboards into static “poster” art.
- Be an advocate. It’s one thing to be a mentor to someone – it’s another to advocate on behalf of them. I want to vocally promote in the workplace and beyond for staff I see doing an outstanding job, whether that is through email kudos or small gestures of gratitude. Putting kindness first over all other values is the way I want to frame my career and showing that consistently on my teams is one way to visibly create impact in others’ lives.
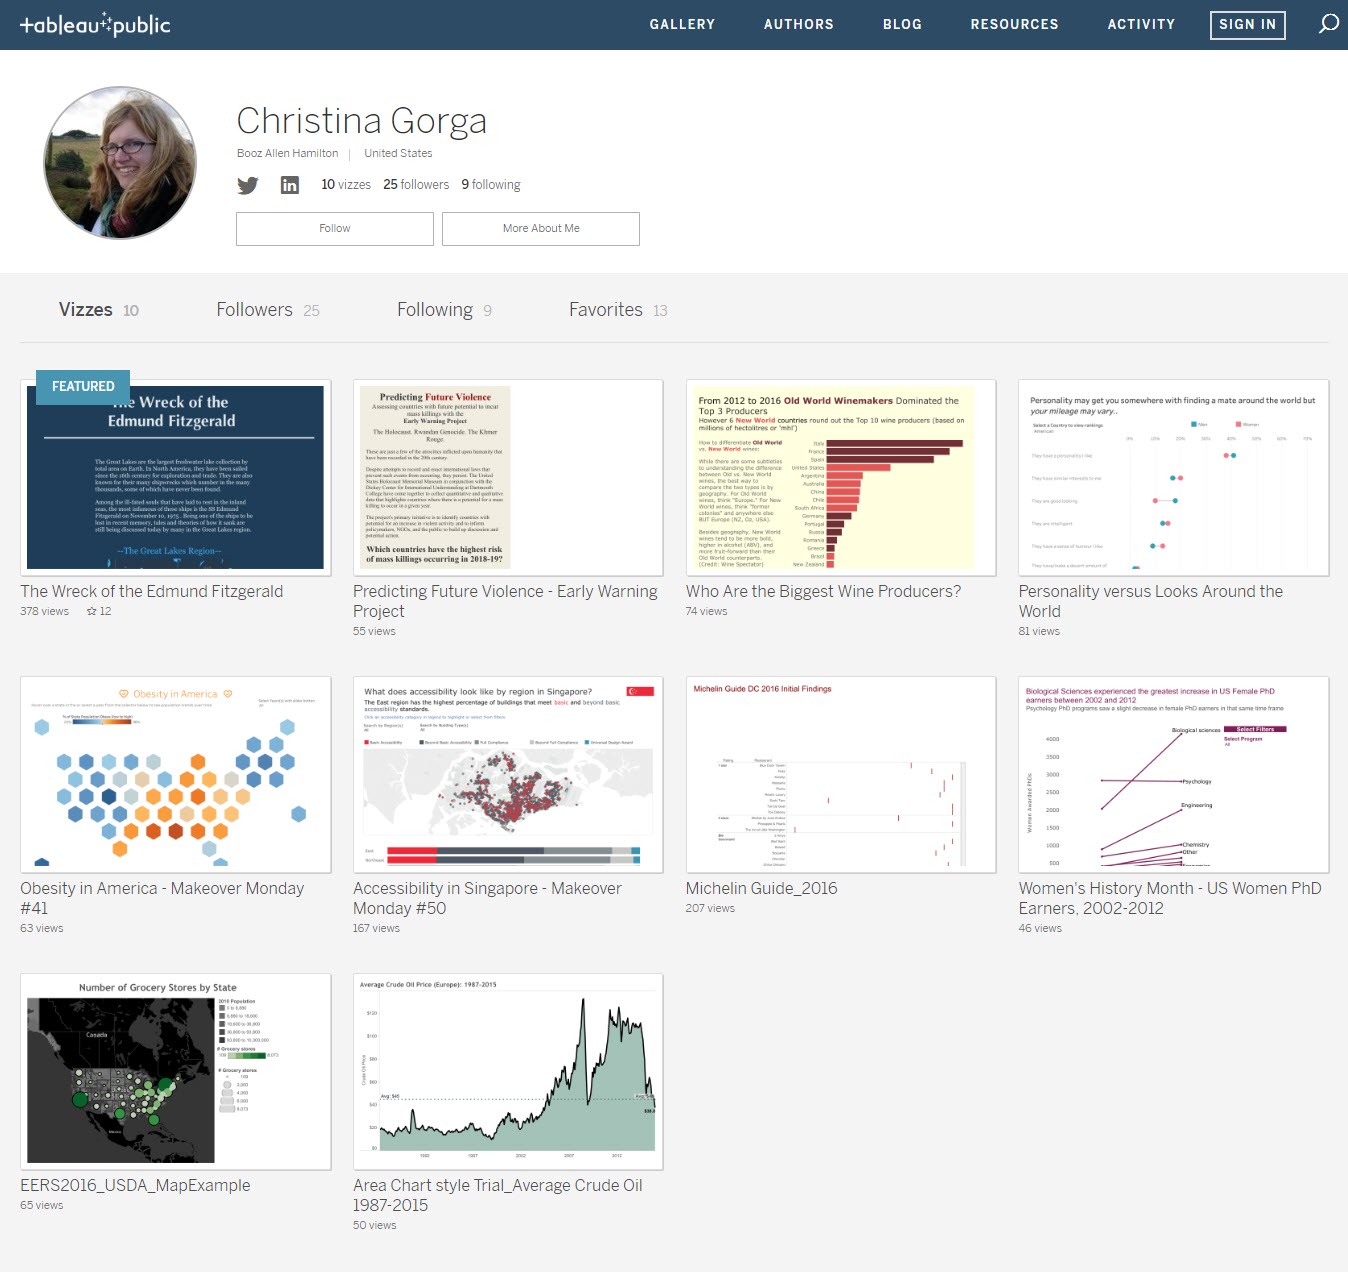
Tableau Public
Link: https://public.tableau.com/profile/christina.gorga#!/