
Readers:
Well, for better or worse, the 2018 midterm elections are over. A lot of discussion surrounding the blue wave entering the election and the Democrats will have reason to be optimistic. They increased their support in large areas of the Midwest and the Rust Belt, regions where President Donald Trump dominated in 2016, most notably in Oklahoma’s fifth district and Kansas’s third, where they flipped control.
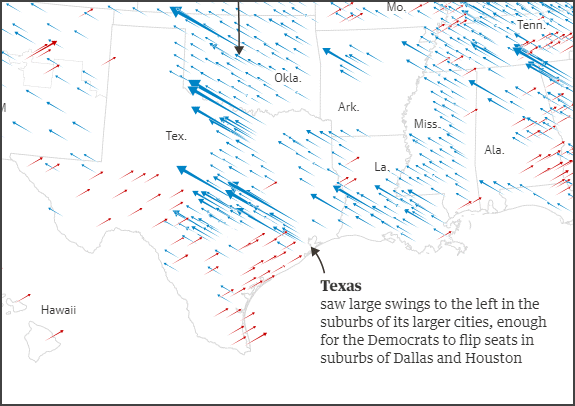
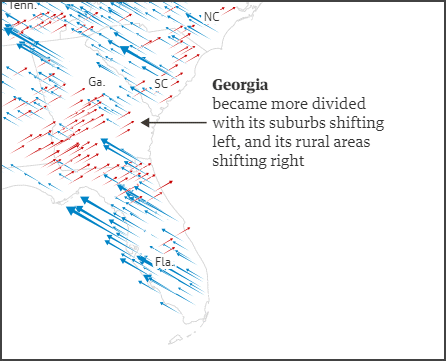
The Guardian had some great visuals today analyzing the midterm election. The one that really caught my eye was the map with scaled, angled arrows to show the Republican and Democrat swings in these midterms for the House compared against those of 2016. For now, I am calling this the Shifting Arrow Map.
NOTE: Blank counties either have no results at the time of The Guardian publishing this article or had an uncontested House race in 2016 or 2018.
Enjoy analyzing the results, whichever side of the fence you are on.
Michael
![]()

Source: Josh Holder, Cath Levett, Daniel Levitt and Peter Andringa, Blue wave or blue ripple? A visual guide to the Democrats’ gains in the midterms, The Guardian, Wednesday, November 7, 2018, https://www.theguardian.com/us-news/ng-interactive/2018/nov/07/blue-wave-or-blue-ripple-a-visual-guide-to-the-democrats-gains.
