Brit Cava Bio
 Brit Cava helps drive real-world impact at Facebook in her role on the Social Good Partnerships analytics team and is based in Silicon Valley, California. She specializes in designing visual analytics, data methodologies, and strategies that help businesses thrive and inspire action. Her visualization work and thought leadership earned earned her the title of Zen Master in 2016/2017. She devotes her free time striving for gender parity by channeling her expertise and community building skills through She Talks Data, a group she co-founded that enriches, empowers, and connects women and men in the analytics industry.
Questions
Michael: Hi Brit. Can you tell my readers what you do at Facebook?
Brit: Sure! The Social Good team at Facebook helps empower non-profits by enabling them to mobilize communities, organize events, increase fundraising and reduce costs with online tools.
As a member of the Social Good Partnerships analytics team at Facebook, my main objective is to enable the Social Good team to make effective, analytically driven, and strategic operating decisions. It’s a very cross-functional role so I interface heavily with data science, product, marketing, partner management, and business operations.
To learn more: https://donations.fb.com/
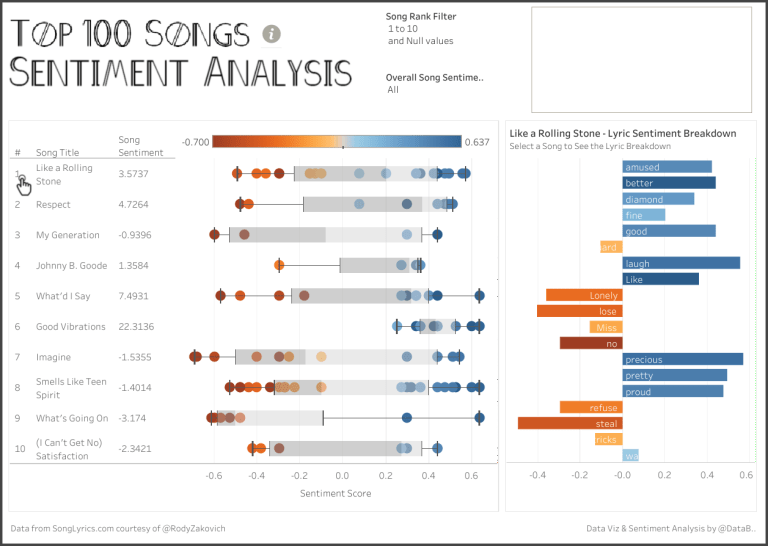
Michael: I really like your Top 100 Songs Sentiment Analysis data visualization you have out on Tableau Public. Can you talk about the process you go through to gather data, design and build a data visualization like this one?
Brit: Ah! I like to work smarter, not harder so anytime I can snag data from someone, leverage existing libraries, etc. I do! I’d have to thank and credit @RodyZakovich for pulling that particular data set and making it available to the Tableau community! In that particular analysis, I really wanted to learn how to use TabPy because at the time I was taking an online computer science course that taught using python. I thought it would be a great way to apply my new skill set in a tool that I was very familiar with. Thankfully, @BoraBeran has written a great user guide on Github and was actively responding to issues and even answered a few of my questions that got me through some initial hiccups. There were numerous obstacles I had to overcome from trying to figure out how to properly install additional packages in Anaconda to a lot frustration because I didn’t realize the data was returned in an array, etc.
Even though I invested a lot of energy into that viz and learning TabPy I really enjoyed the experience. In tech, there’s always something new to learn which makes it exciting yet daunting. I used to get so stressed trying to learn everything. What I learned is that if you’re forcing yourself to learn something because you feel like you have to, it will feel more like a chore and you’ll very stressed when you’re not internalizing whatever it is you’re trying to learn. The experience is so different when you genuinely feel excited about it. It’s that difference that will motivate you to solve tough problems and connect the dots!
Michael: You are one of the co-founders of #SheTalksData. Can you tell us a bit about this organization, and how people can get involved?
Brit: She Talks Data brings together women around the the world who work with data. We aspire to create a comfortable and supportive environment to drive authentic dialogue and to establish meaningful connections through small-group gatherings. Our goal is to build a community of women who can come together to grow professionally and personally. We were originally inspired by Tableau’s Data Plus Women community but our group is tool-agnostic. We host small monthly gatherings and on occasion raise money to help other women do things such as kick-start their own ideas to advance women’s’ rights or to have the opportunity to attend the Tableau Conference.
Since launching 2016, our group spread to other cities in the US! There’s a few ways you can get involved. First, if you’re interested in starting a chapter we do have a quarterly training and a tool-kit to get started. We also have a shop where you can get some awesome swag and 5% of proceeds go to support our operations! Chloe and I also co-host Tableau’s Virtual Tableau User Group where we bring together women from around the world to share their stories live so be on the lookout for those! Lastly, you can find us at the Data Plus Women event at #TC18 or join our Braindate on Tuesday at 12pm if you have any questions or want to brainstorm something!
Michael: I see that you are a Tableau Social Ambassador. Can you tell us how you became a Social Ambassador and what duties this role has?
Brit: The ambassador program’s mission is, “To recognize members of the community who connect, collaborate and share with other people because they recognize the value of helping people see and understand their data.”
As a Social Ambassador, I participate in and promote Tableau’s social media campaigns, occasionally blog for Tableau, and help welcome and support the Tableau community!
Michael: Tell us how you use Tableau at work to help your business partners explore their data and make it actionable.
Brit: What I love about my current role is that when I do use Tableau, among other tools, I’m able to quickly and easily explore my data or communicate my findings and recommendations. When I find that I’m getting many common ad-hoc analysis requests or know I can create something that will add value to our overall team mission I’ll create self-serve operational dashboards. I love being able to leverage Tableau in this way because it frees up my time to focus on research topics and meaningful data analysis to inform our team’s strategies and to support non-profits.
Michael: What is next on your “To Do” list? What can the Tableau community expect to see from you in the near future?
Brit: Something that’s been on my mind lately is how can I scale support for early-career professionals. I’m so often asked for career advice, to review visualizations or resumes, etc. and it can be overwhelming at times to keep up. I used to feel awkward about it given that I still have a lot to learn myself but I’ve realized that I do have a lot to offer on this topic.I’d love to find a way to support more people — especially those that are underrepresented — get into data analytics, thrive, and advance. Hopefully you’ll hear more from me this year on that front!
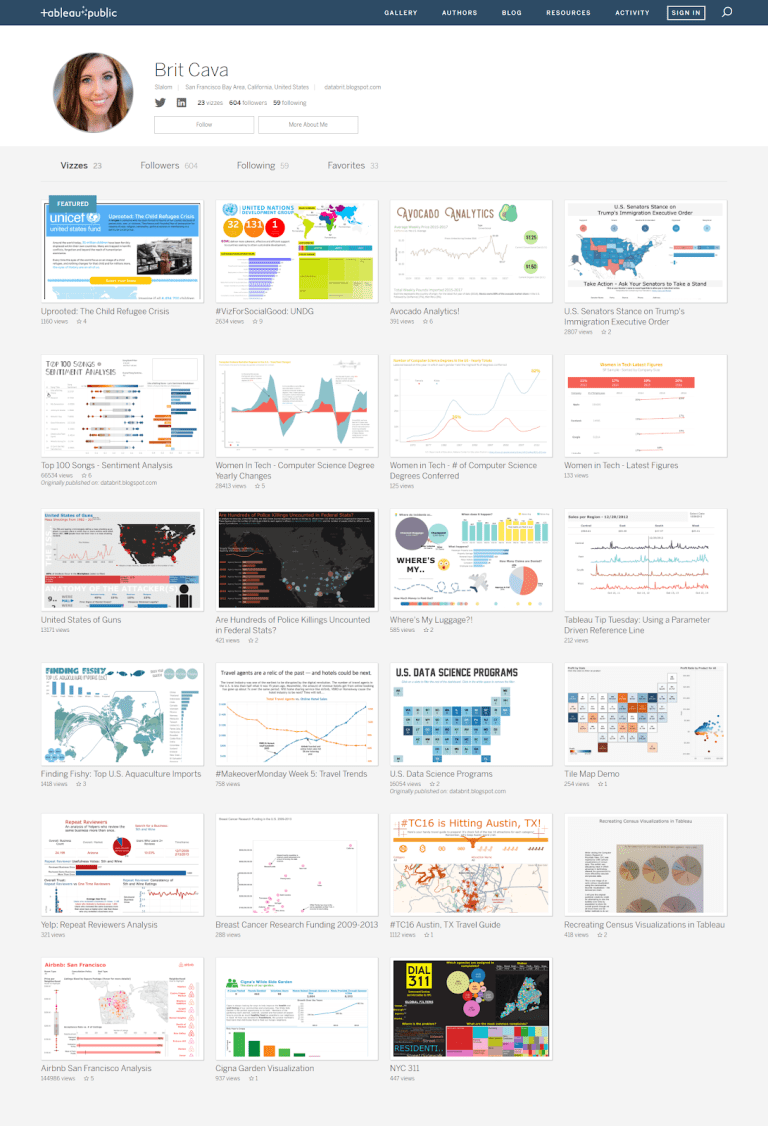
Tableau Public Link: https://public.tableau.com/profile/brit4337#!/