Luke Stanke’s Bio
Luke has been using Tableau for nearly six years. But he does a lot more than data visualization. He has a strong understanding of many things data science. Luke has done things from optimization to classification to predicting things. Really it’s less about the technique and more about the solution. He also have a background in psychometrics, which he will discuss in more detail later in this interview. Luke used to work for a consulting company but now he works for himself.
Questions
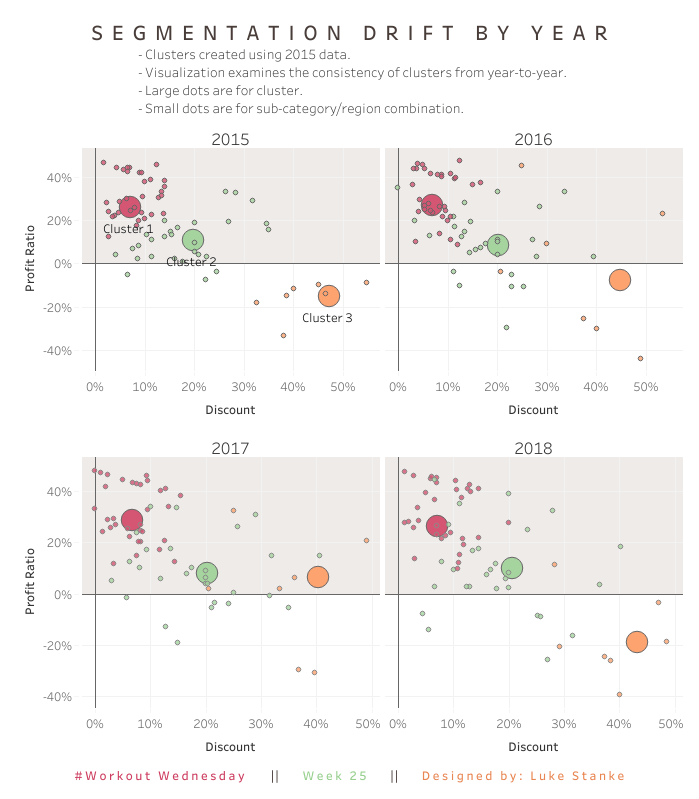
Michael: I really like you’re Profit Variance dataviz you created for Workout Wednesday (WoW). Can you tell my readers the process you go through when you want to create a data viz? For example, how you find the data, design and develop it in Tableau, etc.?
Luke: I think my approach for WOW is just slightly different than when I’m designing any other data product. With WoW, I’m thinking about techniques that I regularly use in Tableau. Sometimes it’s how I build “automated” updates — you know so what when you refresh data things change automatically, sometimes it’s about highlighting under-used statistical approaches that developers SHOULD be thinking about, and sometimes it’s just about having fun.
But if we’re getting specific about visualizations outside of WoW and things that are not work related, then for those I’m thinking about how I can push the boundaries of what is possible in Tableau? Whats new? What hasn’t been done before? What will stretch my understanding? What will grow the community? Those are the questions I’m thinking about.
Link: http://www.workout-wednesday.com/2018/07/10/week-28/

When I am creating something I’m always obsessing over small things. I don’t care if it takes me weeks to get something correct, it’s what I’m going to do. For example, the Harry Potter product I put together for the first IronViz feeder: the order of each of the chords in the stretched chord diagram had to be thought thru. I could have let it look like whatever it did by default, but in my mind that’s just sloppy work. Every detail on spacing on that product was tested a dozen different ways.
I think what I’m saying is I spend a lot of time iterating on my work.
Michael: In reviewing several of your datavizzes, you seem to follow a very minimalist style. Am I correct in my perception and, if so, what criteria do you follow in your styling of data vizzes?
I’m just trying to follow good design principles and if I use them correctly, then the end product will only contain the exact things needed for consumers to be successful in their interpretations of the design.
Luke: Hmmm… I don’t view it as minimalist at all. I think maybe it’s the product of two things, the first being the fact I’m iterating over my design trying to make it the best version of itself. But the second is that I’m just trying to follow good design principles and if I use them correctly, then the end product will only contain the exact things needed for consumers to be successful in their interpretations of the design. So in that sense maybe my designs come off as minimalistic.
Michael: In your profile, when you worked for the Minneapolis Public Schools, you mention developing key social-emotional learning indicators used in many school districts and mined systems for important insights about students. My wife teaches Education at Arizona State University and her focus is brain-based activities and studies. Can you talk a little about these indicators, how you were able to capture them, and how you visualized them?
Luke: So I think here’s a great time to say that we all come from different backgrounds  and we all have different knowledge, skills, abilities, and mindsets that are not data visualization related. So I might digress a bit from the usual data world to talk a little bit about social psychology. For the most part student success is due to —and I’m about to really generalize here—involvement of the family, involvement of the school, and involvement of the community. Classic Bronfenbrenner stuff here. It’s also has to do with how an individual—a student’s choices. Within how a student chooses to respond is the world of social emotional health. About 5 years ago this became a hot topic. A researcher at UPENN, Angela Duckworth, won a MacArthur Genius grant for her work (photo, right). In the studies it showed that a number of things, but above all student with higher self-reported grit scores had higher levels of short- and long-term successes.

Blog Note: Urie Bronfenbrenner was a Russian-born American developmental psychologist who is most known for his ecological systems theory of child development. His scientific work and his assistance to the United States government helped in the formation of the Head Start program in 1965. Bronfenbrenner’s research and his theory was key in changing the perspective of developmental psychology by calling attention to the large number of environmental and societal influences on child development.
For the most part student success is due to —and I’m about to really generalize here—involvement of the family, involvement of the school, and involvement of the community.
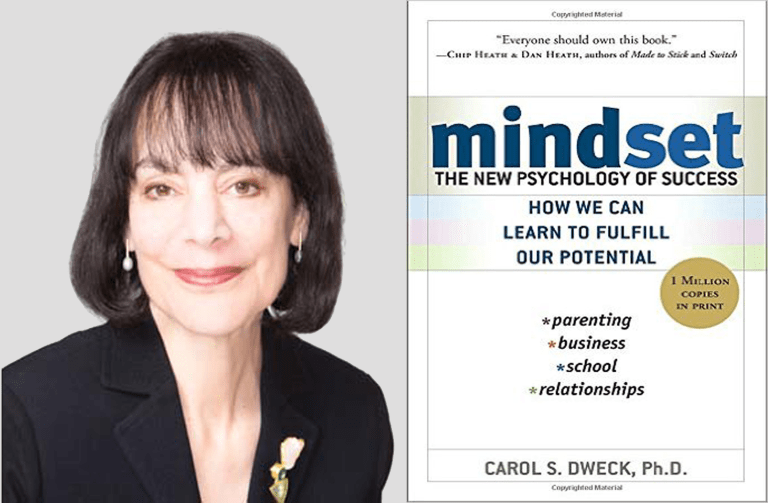
There is also work by Carol Dweck out of the University of Chicago. She looks at our mindset and perception of our ability to learn. Is it fixed or malleable? Research shows our brains are malleable, meaning that we are capable of learning things and that we’re not destined to just know some things. But — and here’s the big thing — your belief in your ability to learn actually has significant effects on your life outcomes. It’s not a huge effect but it’s something. So when I hear people talk in the Tableau community about how they can’t do something or it’d be impossible to learn, I obviously get frustrated. But I digress.
But — and here’s the big thing — your belief in your ability to learn actually has significant effects on your life outcomes.
Back to the work. At MPS, we developed our own measure: persistence. It’s kind of a blend of the two ideas but when we measured it the stats suggested its own unique psychometric quality. We use some “sophisticated” techniques to develop the metric, but in the end, it’s basically a survey that is analyzed using a less know regression model. We then do some basic re-scaling and put it on a 1-10 scale because I personally think it’s easy to understand a 1 to 10 rating.
As for visualizing it. We visualized the 1-10 scores for school and leaders but — if I’m being honest — a lot of the data products were not data visuals or spreadsheets. They were stories about how the metrics functioned. They were documentation.
Michael: Can you tell us three of your favorite Tableau tips and tricks?
First off, any problem — simple or complex —in Tableau is just a series of smaller problems. It’s about breaking it down one part at a time.
Luke: First off, any problem — simple or complex —in Tableau is just a series of smaller problems. It’s about breaking it down one part at a time. But my favorite tips:
1) Unioning data to itself opens up so many more visual options in Tableau. If you see something completely maybe mind bending or something that seems impossible, that’s probably because you are thinking about the data in a singular format. Once you start thinking about what’s possible when you stack the data on itself then a whole new world opens up. That’s probably my most advanced tip. Maybe I’ll step it back for the next one.
2) If you are going to use tooltips in a data product, then tell your consumers it has tooltips and how they can interact with them. As experienced users, it’s natural for us, but for new users they don’t know about that native functionality.
3) Speaking of tooltips, always turn off your command bar on tooltips. Most people don’t realize how easy it is to expose potentially sensitive data to consumers. I really wish Tableau had that set to hide as default.
Michael: What is missing from Tableau Desktop (don’t include anything that is going to be released with v2018.2) and why do we need it?
Luke: Google fonts embedded. We’ve got about 7 native fonts plus the Tableau fonts that are embedded. Almost all organizations are moving to using an open typeface that is often available on Google Fonts. And companies want to brand using their brand standards or design language.
I also wish there was a way to fit regression models right in Tableau —I mean this technically already exists—but I want functions to provide fitted values — aka the predicted number, and the residuals — aka the difference between prediction and actual.
Finally I’d love another function called polygon, it would basically allow me to plot points along a polygon without having to stack a dataset.
Michael: What is next on your “To Do” list? What can the Tableau community expect to see from you in the near future?
Luke: I have got to record another episode of a podcast I do with Zen Master Ann Jackson this week. I’m also doing some research for my next data product topic. I have a few ideas, but all I can say is that it’ll probably be a collaborative effort.
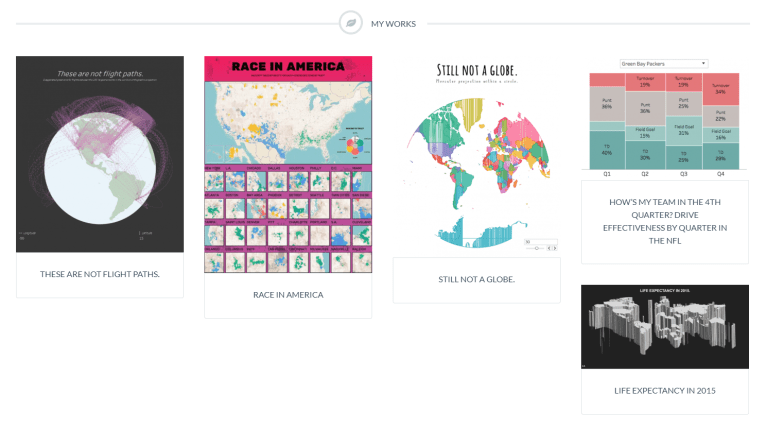
Link: http://stanke.co/#/portfolio