Readers,
Here is Part 2 of my TC18 EUROPE – FRANCOIS AJENSTAT KEYNOTE + DEVS ON STAGE blog post. Part 2 focuses on Arthur Gyldenege, Sr. Product Manager for Tableau Prep providing a demo of Tableau Prep.
Part 1 of this blog can be found here.
Best regards,
Michael

DEVS ON STAGE – Arthur Gyldenege, Tableau Prep
Arthus links to sing, but not everyone likes to hear him sing. So he decided to share his love of music by prepping the data from the Eurovision Song Contest.

Arthur said that at Tableau, they believe to prepare your data, you need to see it. It has to be visual. It also needs to be direct. If you see a problem in the data, you should be able to just reach out and change it. Also, they want to provide us with algorithms to work faster and work smart with our data.
Preparing The Data
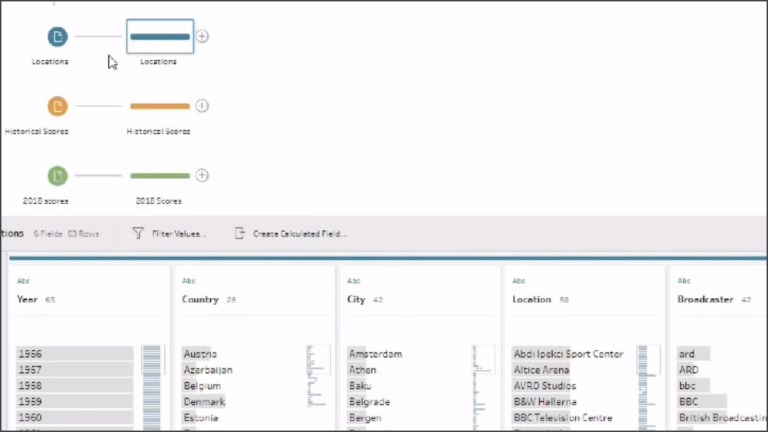
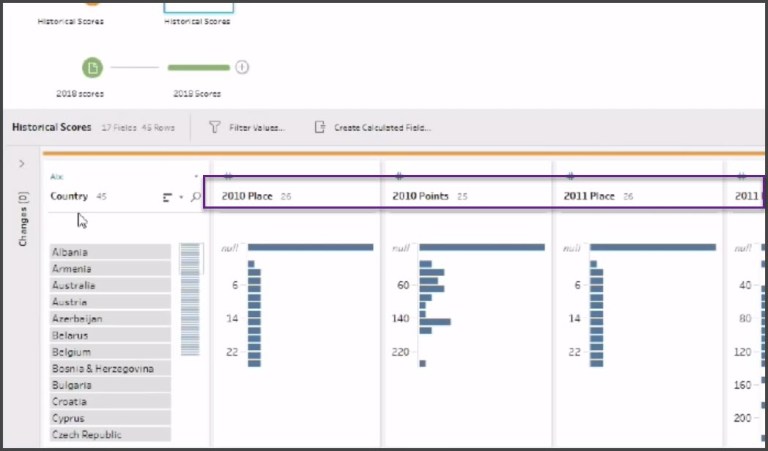
Below is a screenshot from Tableau Prep. He has connected to three Eurovision data source: Locations, Historical Scores, and 2010 Scores.
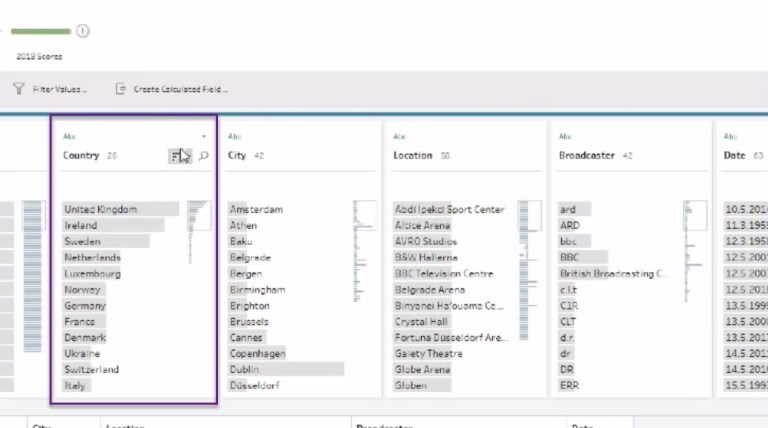
Arthur showed us how Tableau Prep profiles our data. In the screenshot below, Arthur sorted the data to see which Country has hosted Eurovision the most. It is the UK.
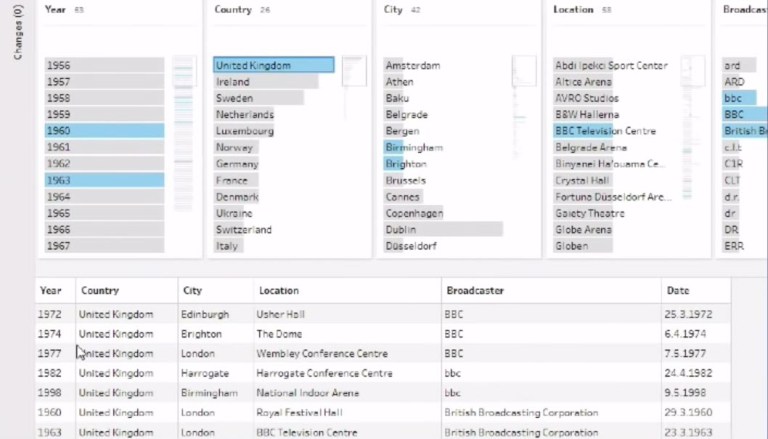
Arthur then clicked on the United Kingdom in the Country column and Tableau Prep shows him all of the related data.
So that was the preparation of the data, now Arthur will show us how to clean the data,
Cleaning The Data
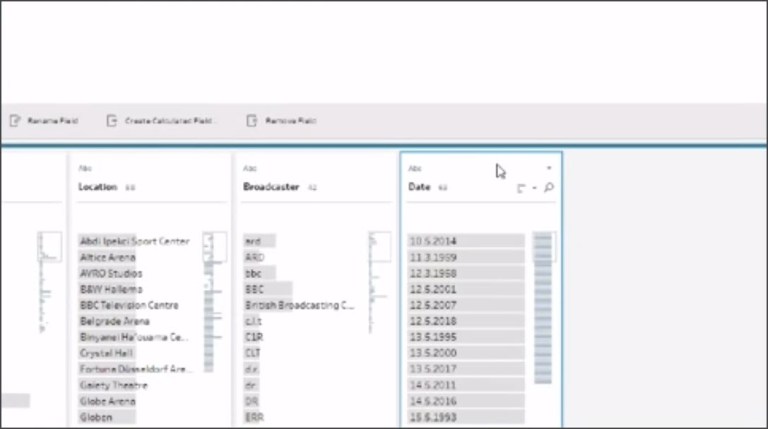
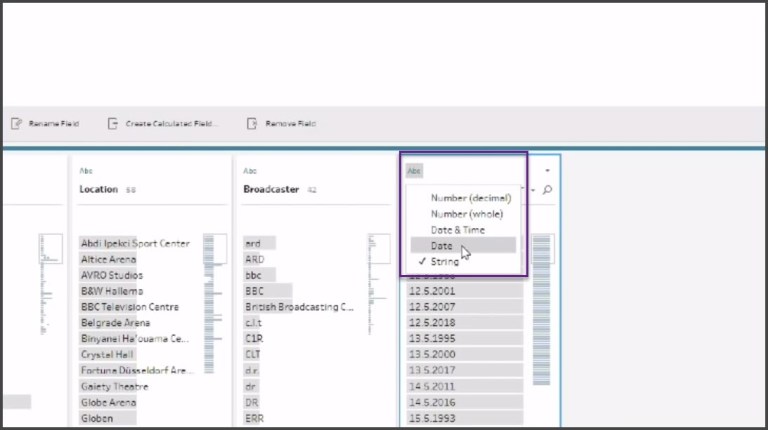
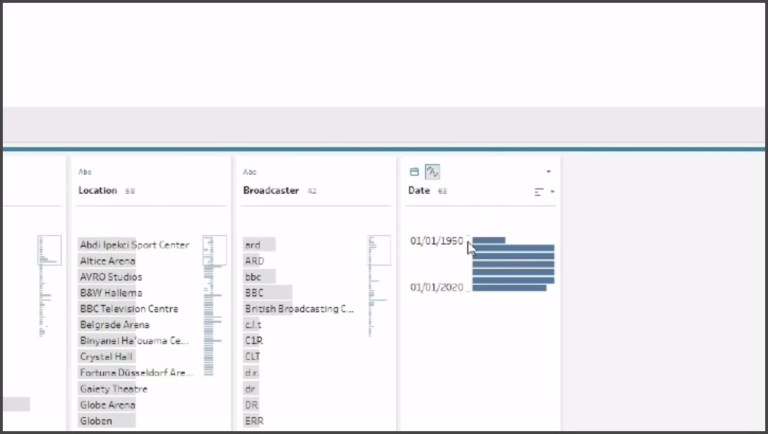
Arthur then showed us how to have Tableau Prep change a String Date to a Date using Auto Date Parse.
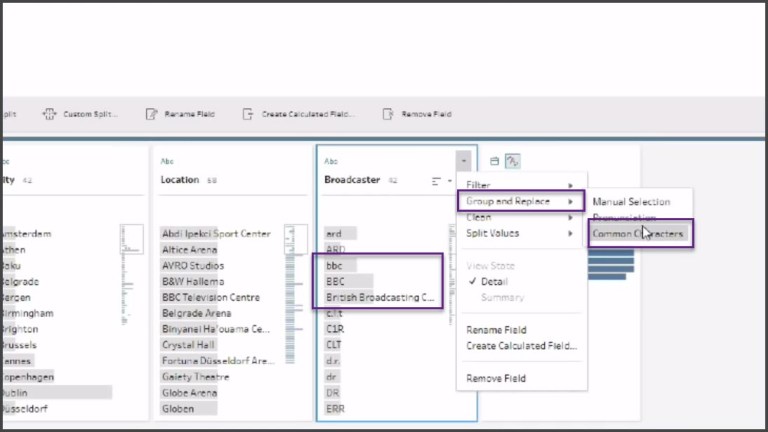
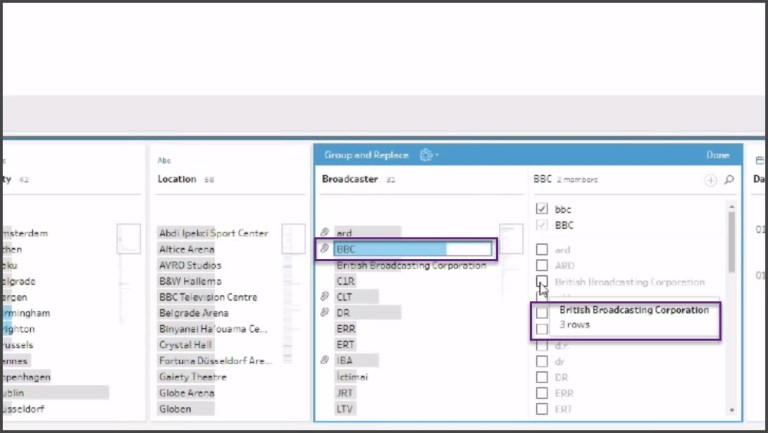
Next, Arthur showed us how to clean the Broadcaster Name. He used the Group and Replace functionality using Common Characters. So, for all the different names for the BBC, it grouped together as we can see from the paperclip.
The spelled out name for BBC is British Broadcasting Company, so he just checked that entry and it is added to the group “BBC.”
Reshaping The Data
Arthur then showed us how to pivot the data. In our example, we have Place and Point for each Country, but we have every Year in the columns.
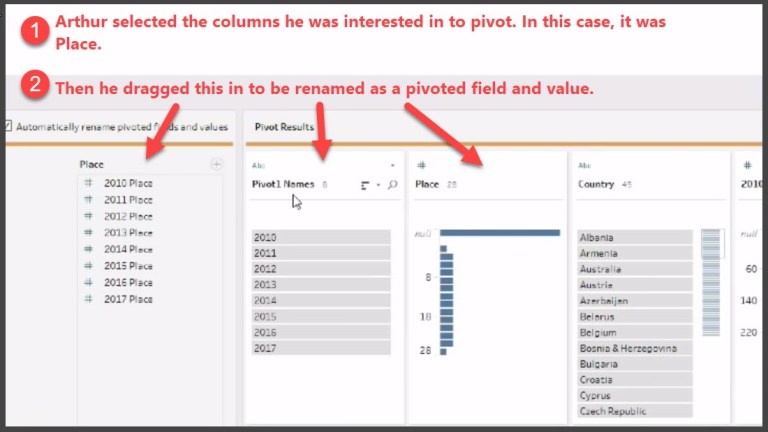
Arthur selected the columns to pivot. In our case, he used Place. Then, he dragged those columns over to create pivoted names and values.
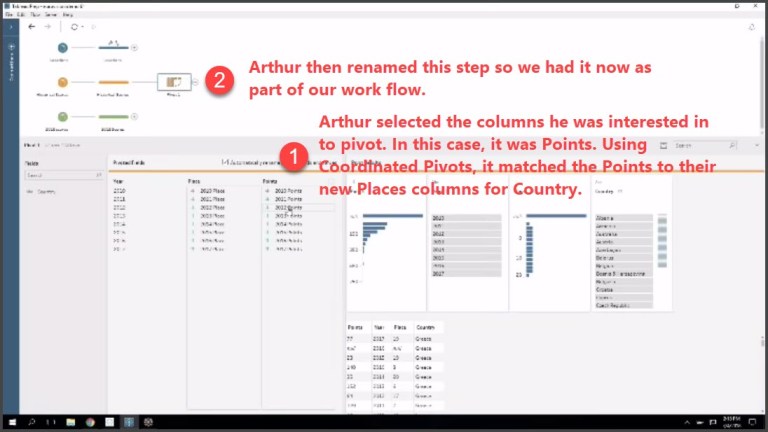
However, we are not done. We also needed to pivot the Points column. Arthur showed us how to perform coordinated pivots. Essentially, we need to pivot the columns containing Place information and do a separate pivot for the columns containing Points information. Then we need to rejoin those columns back together.
In Tableau Prep, we’ll do this by branching the flow so we can work with Place and Points data separately.
- On one branch of the flow, we’ll remove the Points columns and perform a pivot on the Place columns, ending up with a column for Country and Places.
- On another branch, we’ll remove the Places columns and pivot the Points, ending up with a column for Country and Points.
- Then we can rejoin those two branches by doing a join on Country, ensuring that the correct Places and Points are brought back together.
Union The Data
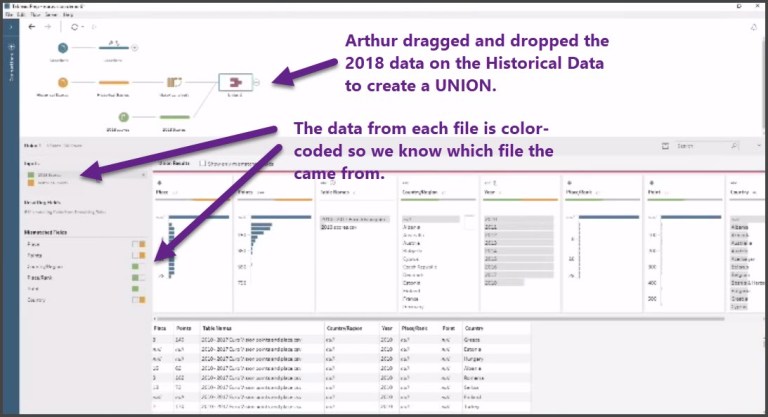
Arthur then showed us how easy it was to Union the historical data with the 2018 data.
Merging Columns
Arthur then showed us how easy it was to merge two mismatched columns. In this case, Place and PlaceRank are the same things, so we wanted to merge these two columns.
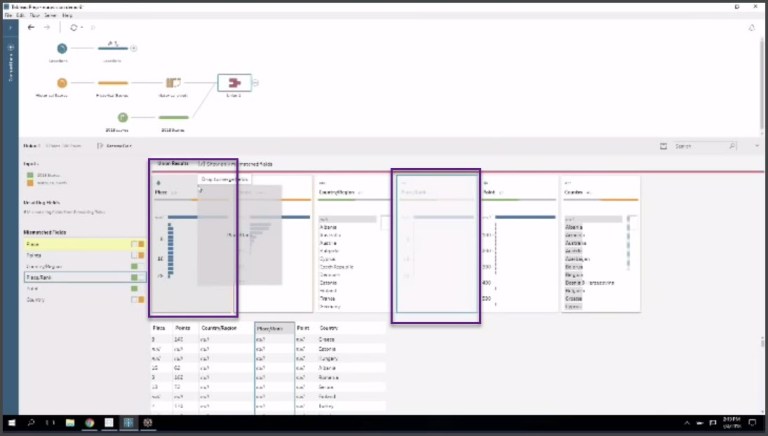
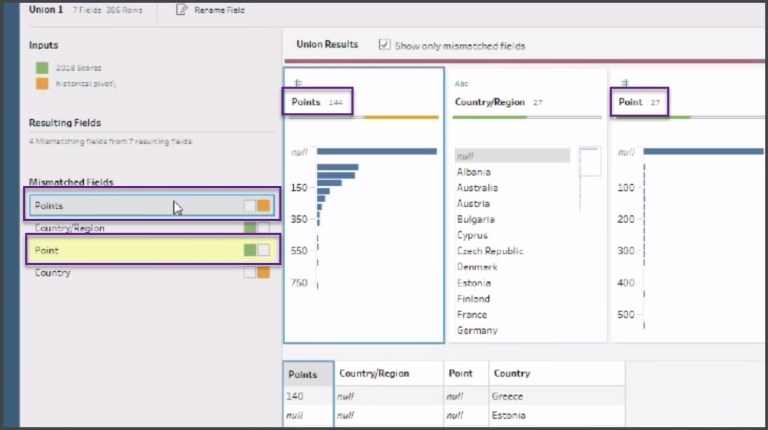
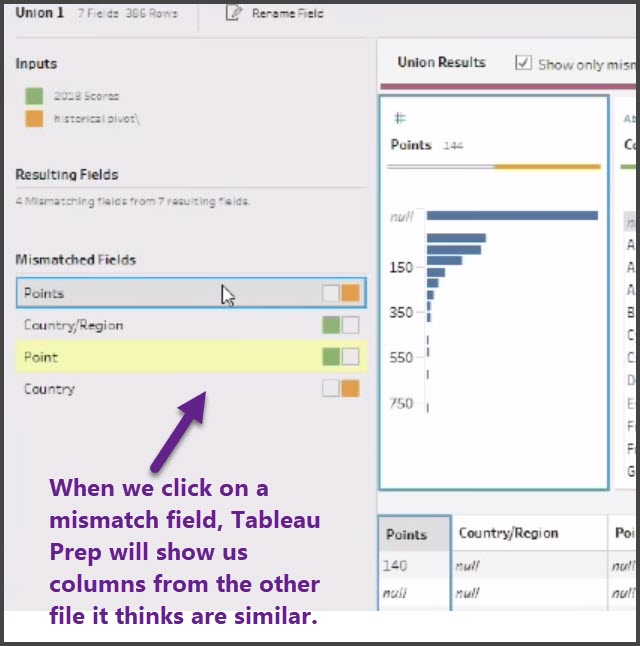
Merging Mismatch Fields
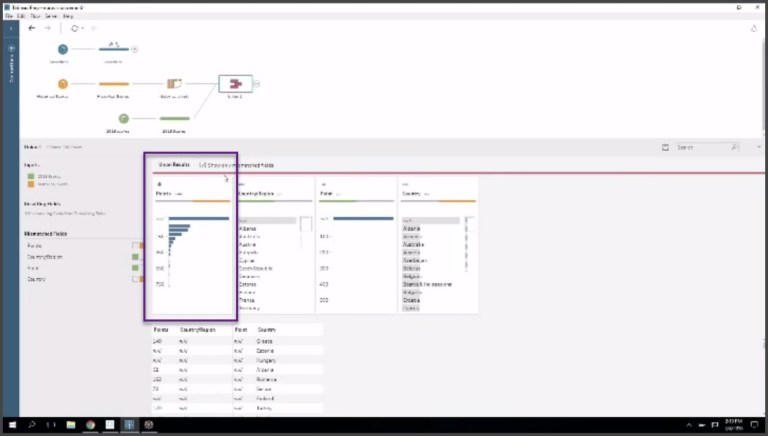
Arthur then showed us how easy it was for Tableau Prep to identify similar mismatched fields and allow us to merge them.
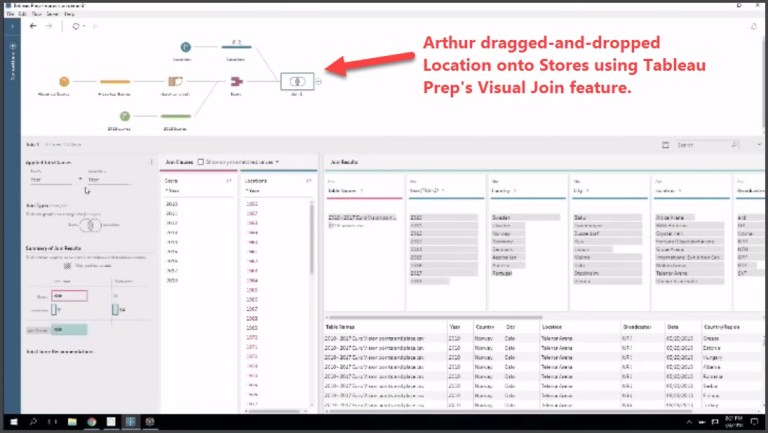
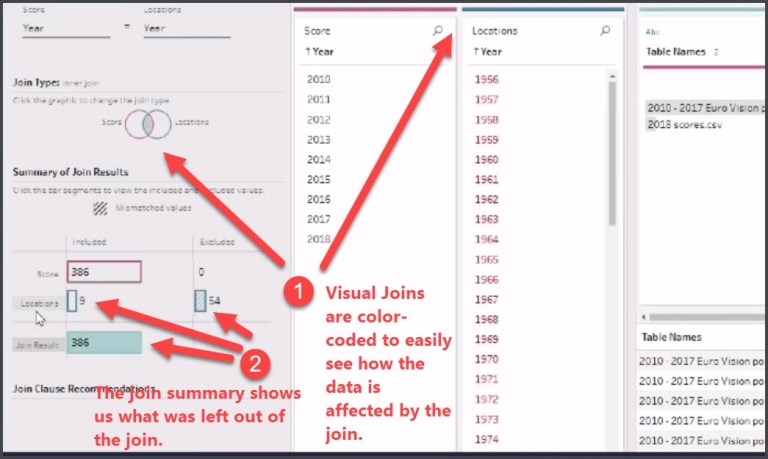
Visual Join
Arthur showed us how simple it was to join files using Tableau Prep’s Visual Join feature.
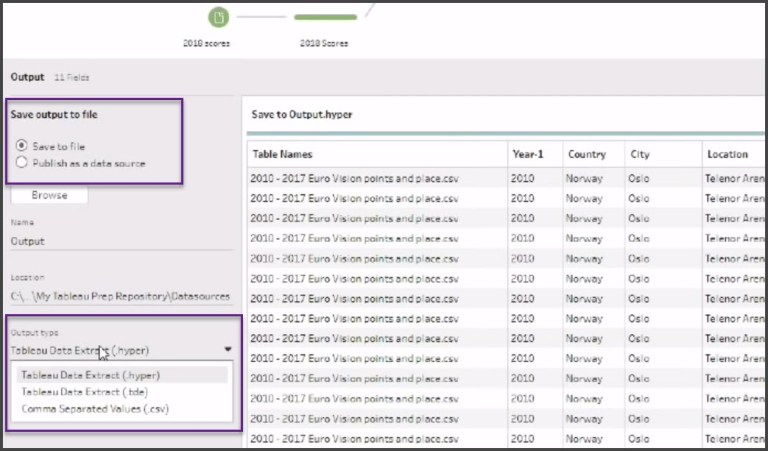
Output Options
Tableau allows us to save out prepped data as a file or we can publish it as a data source directly to a Tableau Server.
Coming to Tableau Prep in July

NEXT: DEVS ON STAGE – Kent Marten, Innovating on Visual Analytics