
Readers:
Tableau Community Spotlight: Ten Questions with The Data Duo
Pooja Gandhi – Tableau Zen Master
 Pooja works for Comcast NBCUniversal in Philadelphia, PA as a Lead Visualizations Analyst. She focuses on transforming data into visualizations to help people understand their business operations more visually. Pooja has a keen interest in market research and helping her company make data-driven decisions. She enjoys using Tableau to tell stories through data. Pooja holds a Bachelor of Science degree in Chemical Engineering and a Master of Business Administration. In the past, she has worked for leading companies including Dow Chemicals, GlaxoSmithKline and the State of Nebraska. Apart from work, she also co-hosts the Data + Women initiative at Comcast to foster meaningful dataviz/career conversations within the Comcast women community.
Being a native of India and having changed residences multiple times, Pooja has a love for travel, diversity, cultures and enjoy learning new languages. She has a very loving family who even when 8000+ miles away have always been encouraging and supportive.
Adam Crahen – Tableau Zen Master
 Adam is the Head of Data Visualization Engineering at Pluralsight, helping to redefine the way the world learns, one viz at a time. He will be creating an Analytics Center of Excellence for Pluralsight. In the past, he has supported the Strategic Partnerships team using Tableau, Alteryx, and SQL to meet internal/external reporting needs.
Previously, Adam worked for the U.S. Department of the Interior and used Tableau and Alteryx to develop actionable insights in the business for all stakeholders from senior executives to the people who can actually fix the problems.
Adam is really passionate about data visualization and using it to make other people’s days easier. He is a frequent speaker about data visualization, this community and my own data journey.
Adam lives in Honeoye Falls, NY with his two beautiful little girls and can frequently be found on his mountain bike. Check out his interactive Tableau resume.
Michael: Pooja, Adam: I have been following your work for a while now and I would like to say it is some of the most creative datavizzes out there. But before I start asking you about data visualization and Tableau, let me start with the question that is on all my readers minds; what is The Data Duo?
Adam: Basically, Pooja bullied me to start this blog. At least, that is what I like to say, ha ha.
Pooja: Ha, right! I would just say that 2 years of launching the blog and he is now a Tableau Zen Master, way to bully him.
Adam: We were both heavily participating on the Tableau community forums in 2016 and Pooja reached out to me to offer some encouragement. At the time, Pooja was #2 on the leader-board so I was shocked to be contacted by her. I did work my way up to #10 though at one point. We became friends during that time and both started regularly participating in Makeover Monday. After just a few months of knowing her, she suggested we start a data viz blog. I thought she was nuts. I didn’t think I had anything to say. I kind of ignored the idea for a month or so. I kept it in the back of my mind though. I was thinking though we come from much different backgrounds, our careers were on very similar trajectories. We were both very determined, hard-working, and doing everything we could to get better at our craft. The first IronViz feeder came around and there was a spot on the entry form to submit a blog post. I asked Pooja if she was still interested and she quickly said yes. We put our heads together to come up with the name and about two days later our blog was born. Poo wrote a quick welcome post and we both posted our IronViz process blogs the next day.
We have over 325 visualizations on Tableau Public.
Pooja: Since then, we have both been very active members of the Tableau community. We have over 325 visualizations on Tableau Public. We’ve written 87 blog posts (at the time of this interview) covering a wide range of topics including our two data visualization projects (#DearDuo and #DuoDare), How-to posts, Tips and tricks, contests, and Adam even tracked how many goals his daughter scored in summer soccer league. As of right now, we have about 127K+ views on our blog. We have a variety of experience dealing with different datasets as a result of extensive practice.
Our 12-month #DearDuo project was a quantified-self journey to get to know each other better through data visualization. It was created following in the footsteps of Giorgia Lupi and Stefanie Posavec (Dear Data) Jeffrey Shaffer and Andy Kriebel (Dear Data Two). #DearDuo also taught us that data collection wasn’t our forte, but we still had fun and learnt a lot about ourselves and each other. Whereas, #DuoDare was launched in hopes to seek feedback and engage with the wider community. We just wrapped up with month 7 of 12 before we complete our second year-long project.
Michael: Both of you are Tableau Zen Masters. Can you tell us the path each of you followed to reach this goal?
Pooja: It was never really a goal, but I am glad our efforts to help and stay dedicated was recognized by Tableau. It takes diligence to maintain consistency in your work. Both Adam and I dedicate ourselves to committed projects to stay active and engaged. By doing so, we are able to keep ourselves up to date with new features, new technologies which eventually helps us grow and move ahead in our careers.
We also find many opportunities to speak and collaborate which strengthens to community around us. I recently visited Singapore and Japan to bring awareness of the Zen Master program and what it means to be a regional champion. I am glad that people from other countries are now stepping up and doing great work in because of all the awareness Tableau and its community brings.
Our efforts to stay committed has not only helped us get the Zen recognition from Tableau but has also got us both amazing new job offers, opportunities to build relationships with industry experts and lots of good friends.
Adam: I would echo everything Pooja said. Our paths to this level are very similar. It takes relentless practice, dedication, hard-work, and it’s a huge time sacrifice. Both Pooja and I are very similar in that we dedicate ourselves completely to whatever we put our minds to and this was no different. Our learning is not over, it continues every day, especially with a tool as deep as Tableau. However, we can now spread our knowledge throughout our organizations and the community. We have some ideas for future projects in the works. I would be remiss if I didn’t mention that we did not get here alone. This community played a large role by being so open, accepting and willing to share knowledge. We owe a lot to those that took the time to nudge us along in our careers, hopefully, we can now return the favor to the next generation of Tableau ninjas.
Michael: My readers get a double bonus! Can each of you tell us three of your favorite Tableau Tips?
Adam:
- My favorite tips revolve around efficiency in tool. Things like Option+Drag (Right-Click+Drag if you are on Windows) to choose Aggregations before dropping a pill on a canvas; direct typing calculations in the column/row shelf and copying complex calculations from different workbooks.
- Customizing Tableau maps by turning off the base and land cover layers, turning on the coastline layer, and changing the pane shading to a different color. You can really customize more than meets the eye. Jeffrey Shaffer has some excellent posts on this.
- Floating text boxes over axes or other element of a dashboard to disable highlighting, etc.
Pooja: My favorite Tableau tip is to use Text boxes as design elements. I have used them in variety of ways to enhance text, as underlines and as ways to get the attention of the audience on a specific dashboard area.
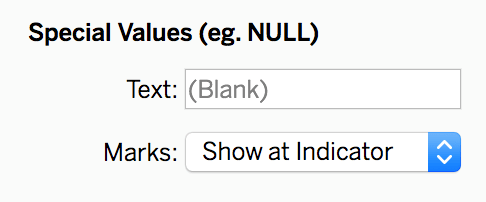
My second favorite tip probably is to use, the text field in the format pane of measure values to say ‘N/A’ or whatever you please instead of converting a number to a string just to accommodate that request.
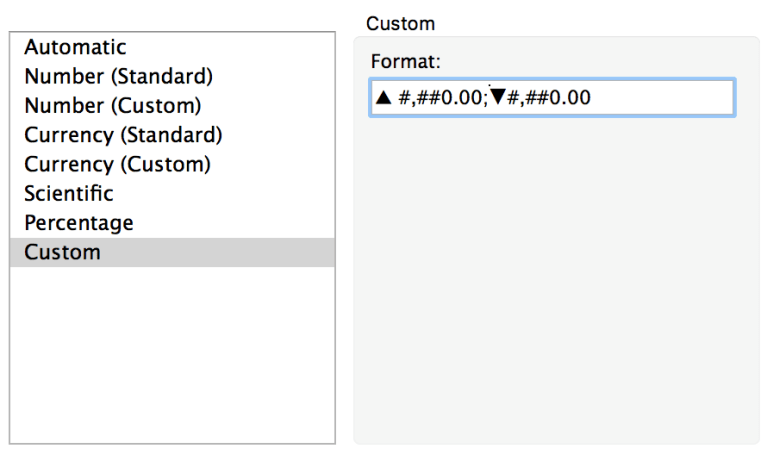
My third favorite tip is to use custom number formats of a numeric field to include ASCII characters.
Michael: Adam, I really like that you include your daughters in some of your dataviz work; I think it makes for some interesting father-daughter(s) time. In particular, I really liked your blog post, Using Siri or Alexa with IFTTT, Google Sheets & Tableau (IoT). Tell us a little bit about this experiment and how your daughters reacted to it?
Link: https://thedataduo.com/2018/01/29/using-siri-or-alexa-with-ifttt-google-sheets-tableau-iot/
Adam: The IoT experiment was pretty fun! Let me just say I thought it was A LOT funnier than my girls did. It all started with me telling them to eat their dinner over and over again, like every other parent in the world. I think I started to get annoyed and I asked Alexa to nag my kids, to which she immediately launched a skill “nag my kids.” I decided to setup IFTTT recipes to use Alexa and Siri to track their behavior. I would say something like, “Hey Siri, add a reminder to the good behavior list….Zoe did a great job putting away her laundry at home.” Of course, it wasn’t all rosy stuff! They really didn’t like threatening to share this list with Santa! I have to say that Siri is a lot smarter. Alexa was allowing my girls to add items about me to the bad behavior list! Siri would only respond to my voice, so I liked her better!
In the end, it was all about pushing technology and trying to integrate with Tableau in a different way while having a bit of fun.
I actually like the other projects I’ve done with my kids better.
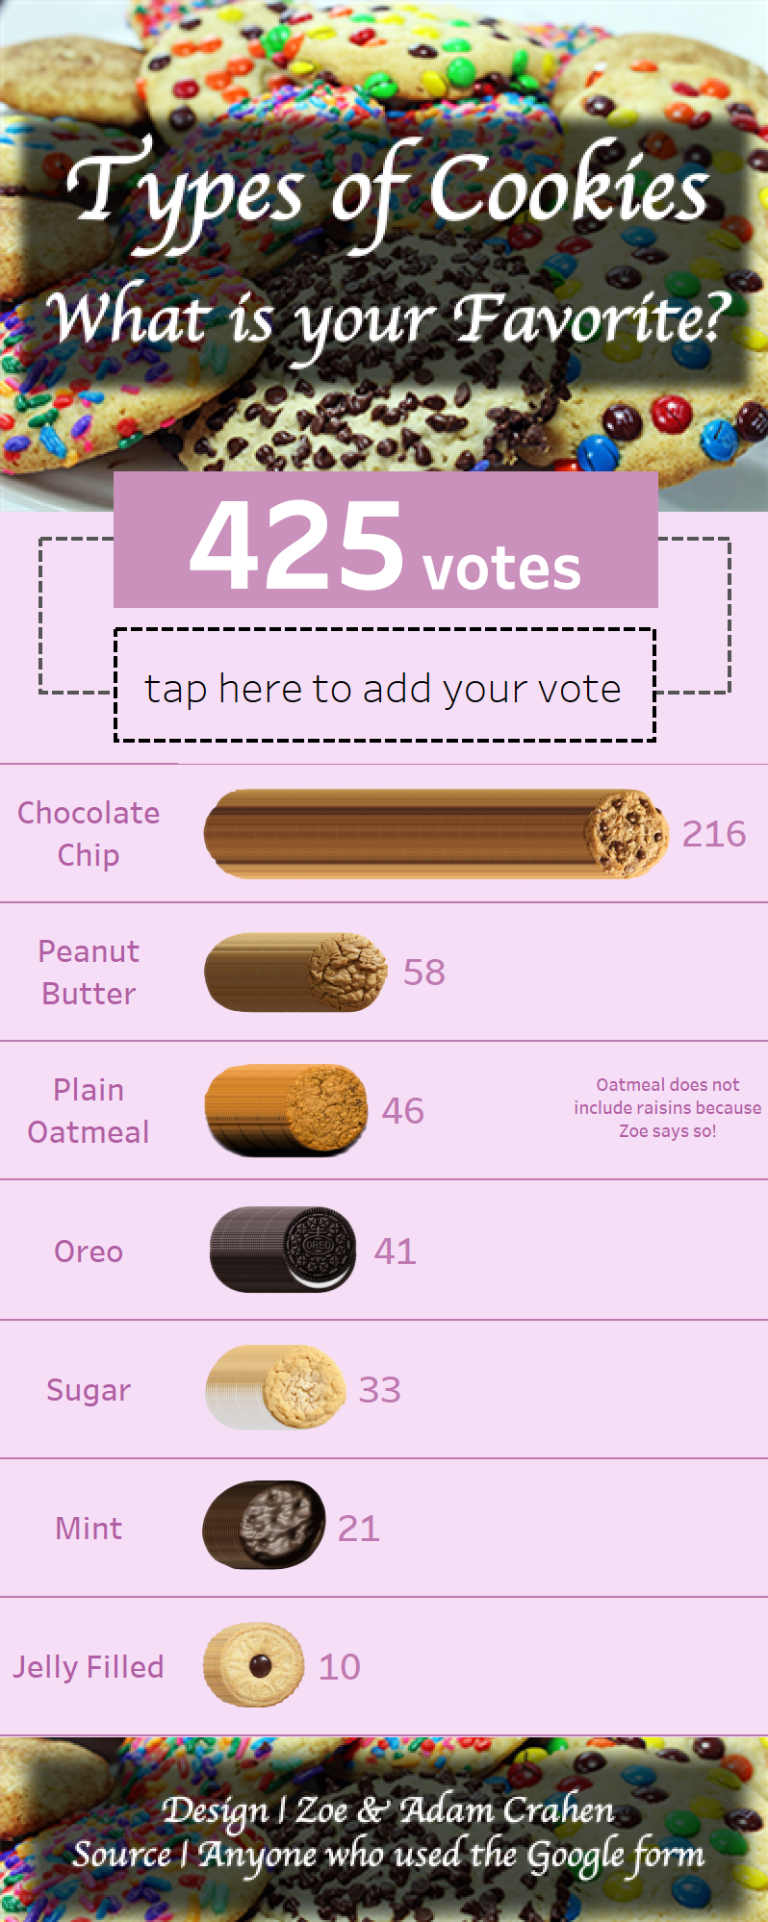
Zoe’s Cookie Survey. Zoe came home with unit chart and was supposed to survey the family about our favorite type of cookie. I worked with her to create a Google form and we put the power of the Twitters to good use. She got about four hundred responses. Zoe did a lot of driving in Tableau in this one.
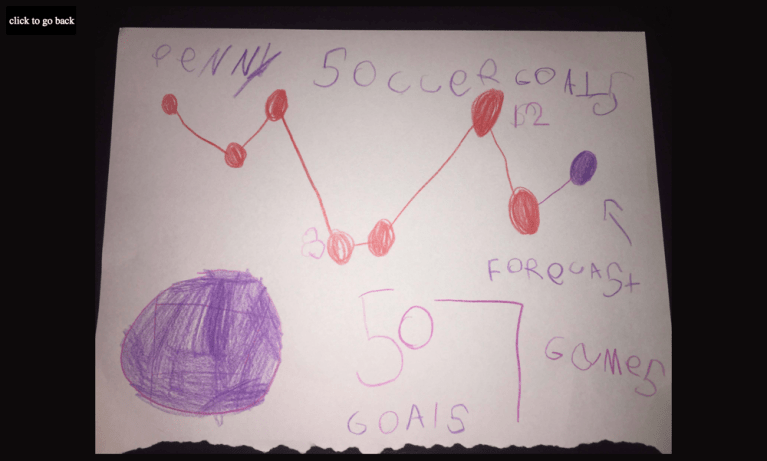
Penny’s Soccer Season. Penny was five at the time of this post (she will be 7 in a few days) and she totally dominated summer soccer. They don’t keep score, but data dads do! I used the opportunity to have her draw her chart and it was a blast. I have her drawing framed in my kitchen, so I see it every day.

Penny’s Family Tree. Penny had to complete a family tree project this year. I asked her teacher if it could be electronic. She actually did almost all the Tableau work including writing conditional calculations. Check out the post for a video of that, it was pretty awesome to see!

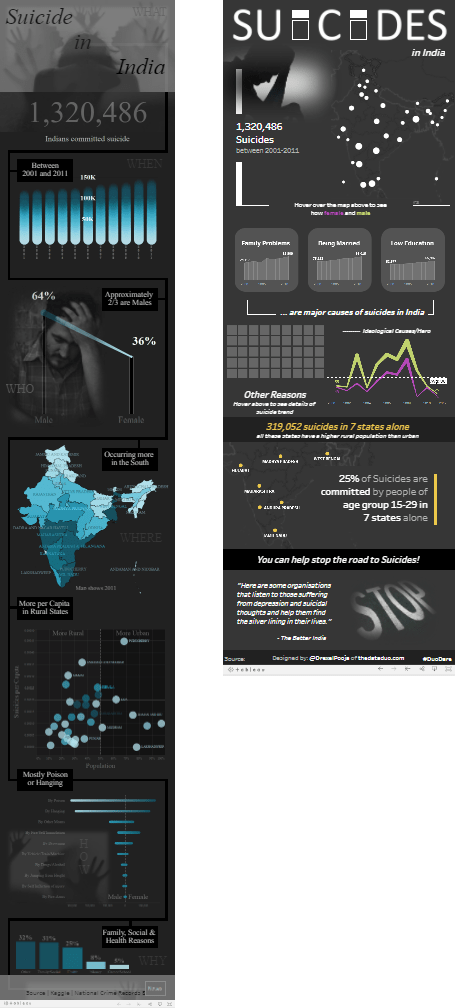
Michael: Pooja, I try to weave some social awareness questions into my interviews. I really loved your infographic #DuoDare 6 | Suicide in India. Back in a previous work life, I spent a month working in Gurgaon, India (outside of Delhi) and had the opportunity to do some travel between some of the States. I am actually quasi-fluent in Hindi (or was back then).
What do you feel the leaders of India can do to help reduce the suicide levels? Also, were you surprised to discover it is more men than women who commit suicide and that it is mostly younger people committing suicide?
Link: https://thedataduo.com/2018/02/11/duodare-6-suicide-in-india/
Pooja: Thank you for the compliments. And wow, that is awesome that you are fluent in Hindi. I originate from Gujarat, a western state of India full of culture and tradition and speak Gujarati as my first language.
Back to your question about suicides, while researching the scary rates of suicides in India, I read that among all the suicides that occur worldwide every year, more than 17% of suicides occur in India. There are many reported reasons like increasing competition, globalization and lack of privacy issues, marital issues and others that cause suicidal thoughts. It is Yes, you are right that the younger generation, especially men are more volatile of the group that commits suicides. The leaders of India can help by being active listeners and by providing non-judgmental support. In today’s fast paced life, no one has the time to fully listen to others’ problems. I feel like by providing that support and guidance to overcome the fear of failure will provide the younger generation the confidence they need to shine and succeed and eventually help them move away from self-destruction.
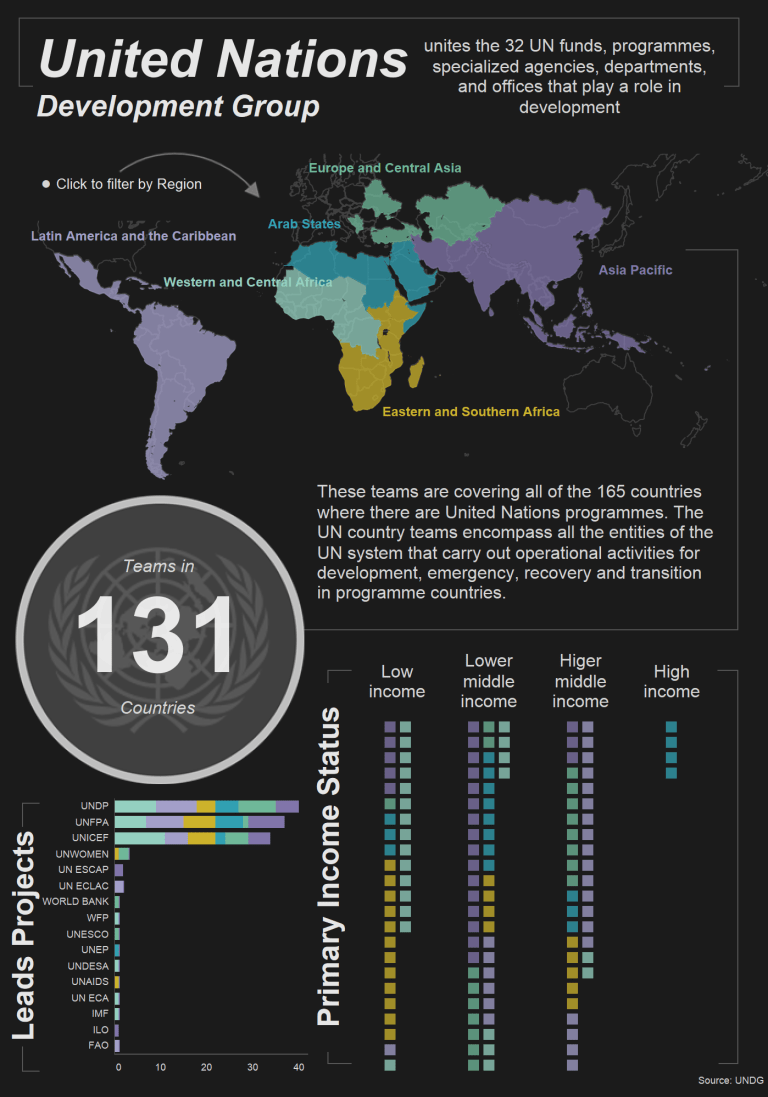
Michael: Last year, both of you had the opportunity to talk to the United Nations about how data can be used to make an impact. Can you tell us a little bit about that experience and also how Tableau can be used to help make this impact?
Adam: Wow, that was amazing to hear that the United Nations selected us to speak with them. This came about from our participation in #VizForSocialGood. We were asked to speak with a panel about the process of working with their data and creating a visualization. Let’s just say their data was less than clean. I actually recorded a 20s+ video of me scrolling through a 445 column wide google sheet. I took the opportunity to talk about the importance of data and how difficult it was to produce something of use from such a messy dataset. I hope they heard that message because their mission is so important and the data was a barrier to entry for many people to donate their time and skills to the project.
Michael: So, the Tableau Conference 2018 in New Orleans is quickly approaching. What can Tableau do to make this an even better conference than before. What are some topics (sessions) that you feel have been missing in the past they should include this time?
Pooja: The Tableau Conference is totally and by far my favorite event of the year. I know that a lot of planning goes into organizing the conference and I think Tableau always does a fantastic job executive their ideas and bring those ideas to life.

Last year, at the Tableau Conference in London they featured a variety of vizzes in a traditional ‘art gallery’ sort of a setting (see photo above). I would love to see that happen in the U.S. conference especially now that there are so many amazing people with unique talents. It is tough to keep up with everything and I would love to see the work of these people recognized at the Tableau Conference.
Adam: With the size of Tableau Conference, it’s almost guaranteed you will miss a session you wanted to attend. I find this to be truer every year. As the community grows, there are more people I want to see and interact with. There just isn’t enough time in the day unfortunately. Last year, they introduced lightning talks in the expo hall. Several sessions I wanted to see were in this format, which was not recorded. The timing was a little weird as you had to leave a main session early or skip one if you wanted to attend a lightning talk. I hope the schedule is a little friendlier this year so I can get to as many sessions as possible! I don’t think topics are generally missing, I just find I can’t get to everything I want. Thankfully, most of the sessions are recorded. One improvement that I would suggest is for Tableau to record both the screen and the presenter. It really isn’t the same experience watching a recording if you can’t see the speaker.
Michael: In your regular work situations, what are they key pain points you see your business partners are having with data and data visualization?
Adam: My key pain points revolve around system limitations and data literacy. Our team is working on our architecture help with the first issue which really came about by the fast growth of the company. My new role is to create an analytics Center of Excellence and help bridge any gaps with data literacy. Thankfully, our organization is pretty data-driven so I have been able to do more in terms of data visualization than in my last job. I am thankful to be a part of an insanely talented team. This was the main draw for me to join Pluralsight. The company is amazing, but the people are even better!
Pooja: One of the major pain points I have seen in the work environment is that people are generally not sure of the requirements and are sometimes unaware of their own need. The good ol’ text tables and number fetching from a huge spreadsheet still is true for many functional areas.
Data literacy is also an area of concern in a few business units where people aren’t sure of their ability to gain insights from the data that’s being presented. This also co-exists with knowing to ask the right question to the analyst in order to receive the answer they were hoping for from the visualization that’s being presented.
Michael: Do you feel Tableau Maestro will be a better (or good) alternative to Alteryx?
Pooja: Tableau Maestro uses the same governance structure of Tableau and let the user navigate between data prep and analysis pretty easily while Alteryx is a whole another software. I haven’t used much of Alteryx so I can’t comment on what is a good alternative but I feel like given a Tableau user and the fact that Maestro is part of the software will make it easier for a Tableau user to rely on Maestro’s functionalities.
Adam: I haven’t really used Maestro yet as it is still in beta, so I can’t really compare it to Alteryx at this time. However, I use Alteryx daily to create solutions to data engineering and business problems. I love Alteryx. I think it is the data Swiss army knife. I think there is going to be a place and use-case for both tools, but I would be surprised if Alteryx doesn’t have a leg up in this space for some time. The tool is more mature, feature rich and so deep, which ironically is why I love Tableau so much! I love having the combination of Tableau and Alteryx.
Michael: Finally, what is next on your list of things to conquer?
Pooja: We have exciting plans to continue being engaged with the community. We are in a nice spot to spread knowledge that we have gained over the years in the community and do good with data. While we will continue to participate in various activities and projects, both Adam and I have plans to travel globally and speak at various conferences. Our next speaking engagement is at Predict Conference in October in Dublin, Ireland. We are then headed to London to speak at the very popular #LondonTUG.
Apart from that, I also co-host the Data + Women initiative in Philadelphia and we hope to include the larger Philadelphia community and talk about diversity at workplaces and how it benefits the organization as a whole. We have exciting plans for the year and we hope they materialize as planned!
Adam: One thing we wanted to accomplish this year was to speak abroad. We have signed on to speak at Predict 2018 in Dublin, Ireland in October 2018. We are really looking forward to this trip and the chance to engage with people from around the world.
I want to continue to be active in the community and keep writing posts others find useful in their day to day jobs. I want to continue to give back to the community as others gave to me. Pooja and I have some ideas in the works along these lines. Hopefully, we can get that up and running as our current project is nearing an end.
I have some lofty goals in my new role at Pluralsight, including to become proficient in D3, setting up a COE, and just generally continuing to kill it!
Gallery Image Link: https://thedataduo.com/gallery/


One thought on “Tableau Community Spotlight: Ten Questions with The Data Duo”