
Readers:
It has been a while since I posted a new Tableau Deep Dive. This one was precipitated by a need to have the ability to display multiple rows of column grand totals in a crosstab view.
Currently, Tableau states that this functionality is not available in any versions of the existing Desktop product and that no workaround is available.
However, I was fortunate to have reached Blake Thomson on Tableau’s Technical Support Team. Blake would not take “it cannot be done” as an answer and came up with an elegant solution to do this. Since there are many posts out in the Tableau community from people wanting to know how to do this, I thought I would share with you the solution Blake came up with for me.
Kudo to Blake for his tenaciousness and strong desire to help the customer.
Best Regards,
Michael
How to Display Multiple Rows of Column Grand Totals in a Crosstab View
The Issue (Use Case)
This is similar to the Tableau Community Issue noted here: https://community.tableau.com/ideas/6232
Many of our monthly reports have maximum, minimum and average rows at the bottom of the data pane. Currently, the report does not work well in testing because the Grand Totals rows roll upwards.
The Solution
To fix this, we can hide all the rows except the grand total on those worksheets. The following Tableau Community discussion provides a nice solution.
Only show grand total in a table?
On the grand total worksheets, apply a “1” discrete row header and then hide that partition, leaving only the grand total row. We can use the generated [Number of Records] field, which is just a 1.
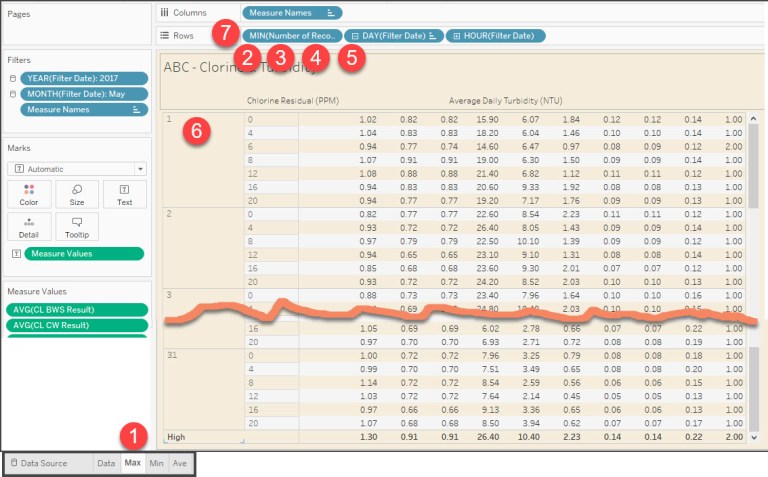
- Open the Max worksheet.
- Right-click & drag [Number of Records] from the Measures Pane to the Rows Shelf.
- Select MIN(Number of Records) and click OK.
- Right-click MIN(Number of Records) and select Discrete.
- Drag MIN(Number of Records) to the left of DAY(Filter Date).
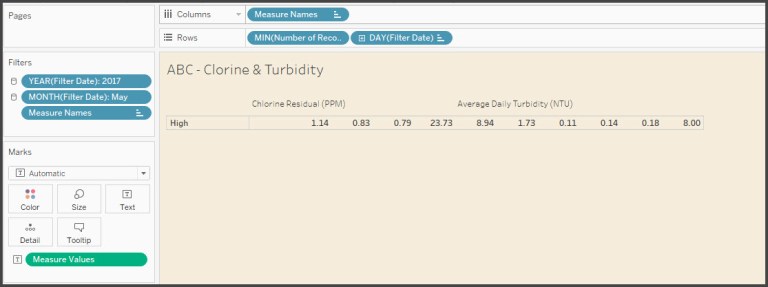
- On the table, right-click on the “1” row header and select Hide.
- Right-click MIN(Number of Records) and uncheck Show Header.
*Optional: Right-click on the “Grand Total” title and select Format to change the title.
Viola!
Repeat the above steps for each grand total worksheet.
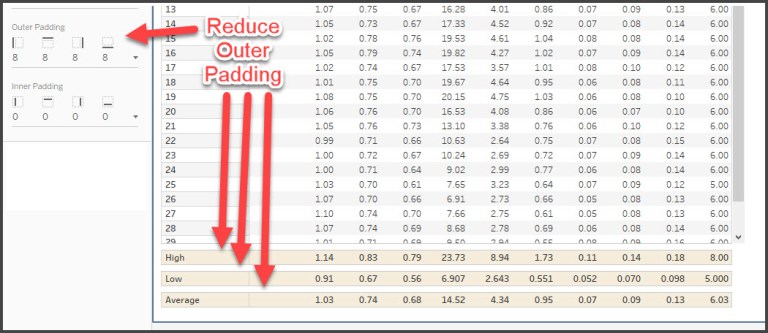
On the dashboard, we can apply color shading to the worksheets and reduce the outer padding to eliminate gaps between the rows. In our case, the outer padding was reduced to zero (0).
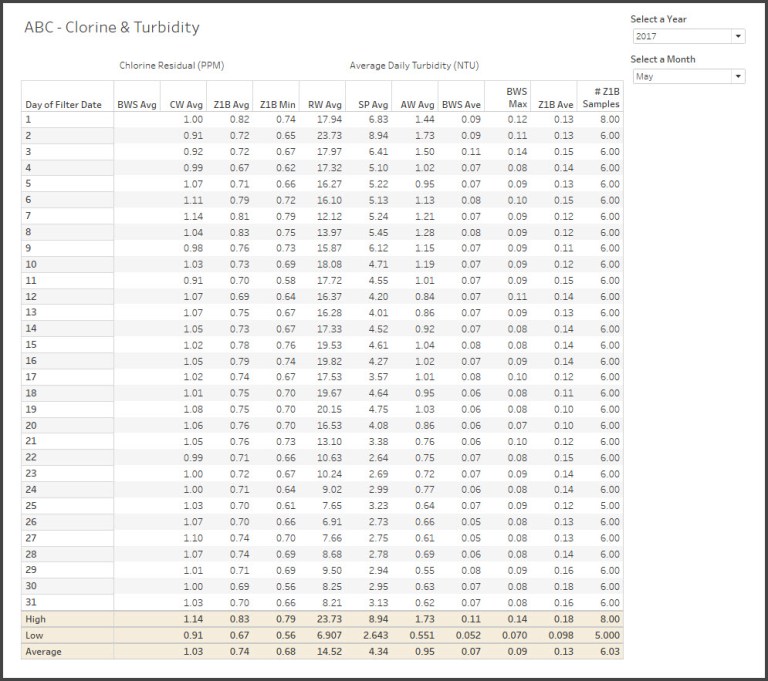
Here is the final workbook demonstrating the results of the workaround.
For additional reference, here are some links to Tableau’s Product Help.
Format at the Worksheet Level
https://onlinehelp.tableau.com/current/pro/desktop/en-us/formatting_worksheet.html
Size and Lay Out Your Dashboard
https://onlinehelp.tableau.com/current/online/en-us/dashboards_organize_floatingandtiled.htm
