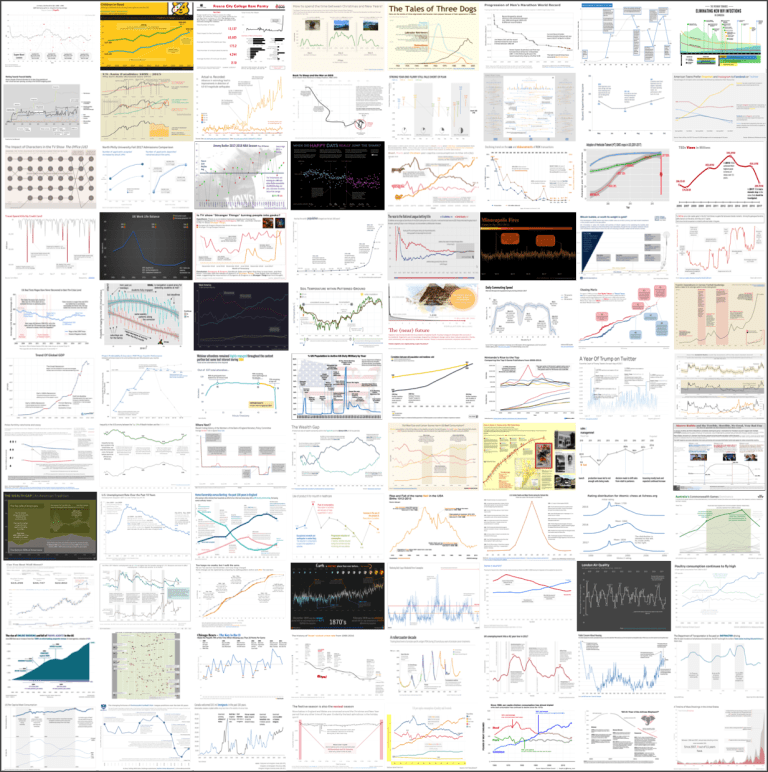
At the beginning of the 2018 new year (earlier this month), Cole Nussbaumer Knaflic of Storytelling With Data fame, challenged the dataviz community to create an annotated line graph on a topic of our choice. Nearly 90 people took her up on this challenge! Cole has just posted a summary where she has shared with all of us the entries we submitted for this initial installment of the #SWDchallenge.
Cole noted that people used a variety of tools—many in Tableau, but a number also used R and Excel. People visualized data from a wide range of topics:
- Sports (football, baseball, soccer, basketball, mixed martial arts, Australia’s commonwealth games),
- Meat (due to a number of crossover entries with a recent #MakeoverMonday),
- Economic indicators (from the US, UK, Canada, and around the world),
- Financial data (the rise of bitcoin, gold vs. oil, playing the stock market, the wealth gap),
- and more.
I have provided a link below for you to go to Cole’s site and see her summation on the annotate graphs challenge.
Best regards,
Michael
You can read the blog post in more detail on Cole’s site by clicking here.