
Readers:
For this Tableau Secrets blog post, someone else has already done the heavy lifting, so I am going to refer you to his web site, Data + Science.
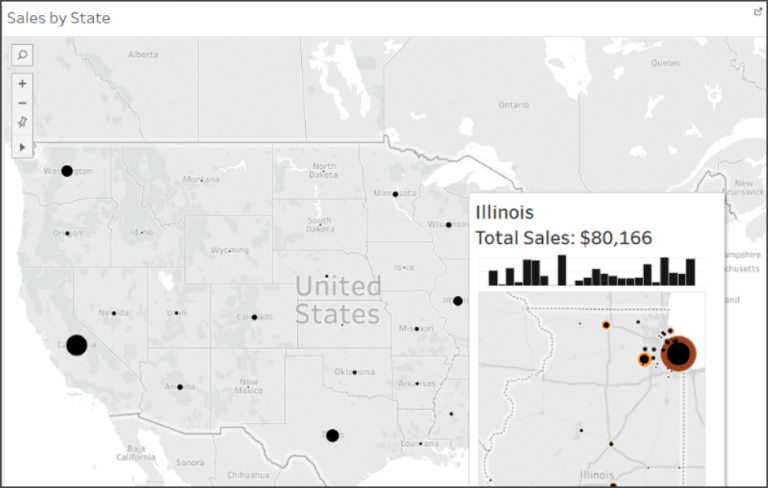
Back in July 2014, Jeffrey Shaffer wrote a blog post Tooltip Canvas in Tableau – A Mockup for Chart Functionality within Tooltips based on an idea he added to the Tableau Ideas forum back in April 2013. The basic idea was adding the capability of having a visualization inside of a tooltip. This functionality was demonstrated on stage at the Devs on Stage at the 2015 Tableau Conference. After that conference, Jeffrey watched beta after beta to see if this functionality had been added. The functionality was mentioned again at the 2016 Tableau Conference, but it wasn’t until earlier this year that he saw the feature in an Alpha release. He was able to work with that Alpha release and try out different features and he knew that the beta release wouldn’t be too far behind.
Well, yesterday was the day. Viz in Tooltips was released as part of Tableau 10.5.
Before I provide you the link to Mr. Shaffer’s blog post, let me provide you a little information about him.
 Jeffrey Shaffer is Vice President of Information Technology and Analytics at Recovery Decision Science and Unifund. Mr. Shaffer joined Unifund in 1996 and has been instrumental in the creation and development of the complex systems, analytics and business intelligence platform at Unifund. Mr. Shaffer holds a BM and MM degree from the University of Cincinnati and an MBA from Xavier University where he was the winner of the 2006 Graduate Student Scholarly Project in Research. Mr. Shaffer has attended the Harvard Business School’s Executive Education Program, is a Certified Manager of Quality and Organizational Excellence through the American Society for Quality, a Certified Project Management Professional through the Project Management Institute and has completed Six Sigma Green Belt and Black Belt training with the Xavier Consulting Group.
Mr. Shaffer is also Adjunct Professor at the University of Cincinnati in the Carl H. Lindner College of Business teaching Data Visualization where he was awarded the 2016 Adjunct Faculty of the Year Award for Operations, Business Analytics and Information Systems. He is a regular speaker at conferences, symposiums, universities and corporate training programs on the topic of data visualization, data mining and Tableau. Mr.Shaffer has taught data visualization at the KPMG Advisory University, KPMG Global Analytics and for the University of Cincinnati Center for Business Analytics. He was a finalist in the 2011 Tableau Interactive Visualization Competition, one of the Elite 8 in the 2014 Tableau Sports Visualization Contest, the winner of the 2014 Tableau Quantified Self Visualization Contest and competed in the 2014 Tableau Iron Viz Contest. He was selected as one of twenty-one Tableau Zen Masters in the world for 2015-2016, was selected as a Tableau Social Media Ambassador 2015-2017 and is a founder and leader of the Cincinnati Tableau User Group.
O.K., here is the link to Jeffrey’s post.
Tableau Tips – 10 tips for Viz in Tooltips (Now Available in Tableau 10.5)
Source: Shaffer, Jeffrey A. , Tableau Tips – 10 tips for Viz in Tooltips (Now Available in Tableau 10.5), Data Plus Science, LLC, October 17, 2017, https://www.dataplusscience.com/TableauTips12.html.
