
Readers:
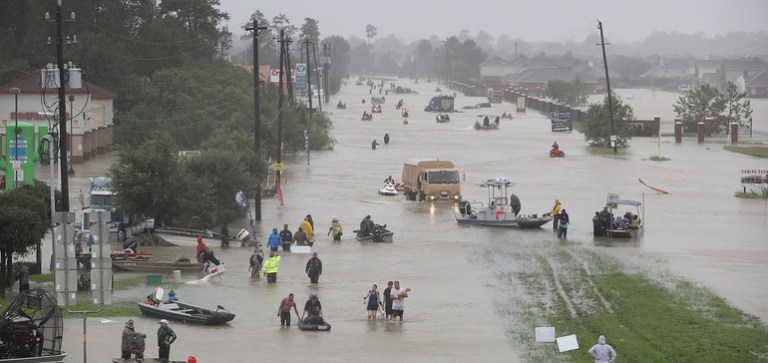
Like most of you, I have been following the “500-year flood” (some news sources have now upgraded it to the 1,000-year flood) caused by Hurricane Harvey, which made landfall on Aug. 25 on Rockport, TX. Rainfall reached more than 50 inches in some parts of Houston, which would be equal to the amount of precipitation that Washington, D.C. has experienced over the past 15 months.
Texas has a very special place in my heart. I lived in College Station when I worked on my undergraduate degree at Texas A&M University. Since the town was much smaller back then, a real treat for us was to drive down to Houston and walk around the Galleria Shopping Center or head down to Gilley’s in Pasadena to have a great steak and dance.
I watch in horror what has happened to Houston and this great part of the Lone Star State. I say a prayer for the people who perished and remain hopeful for those who have been displaced. I encourage everyone to find valid, legitimate agencies collecting money for these families and donate. Even $5 will help.

I have always felt Texans are a strong, proud, resilient group of people. They tend to watch out for their neighbors and will lend a helping hand without being asked.
This older slogan (see image above) from Texas came to mind last night. I thought I would share it to hopefully bring a smile to your face in these tragic times.
Be strong, Texas! You are as tough as nails! God bless all of you and the various agencies who are helping you through this.
Best regards,
Michael
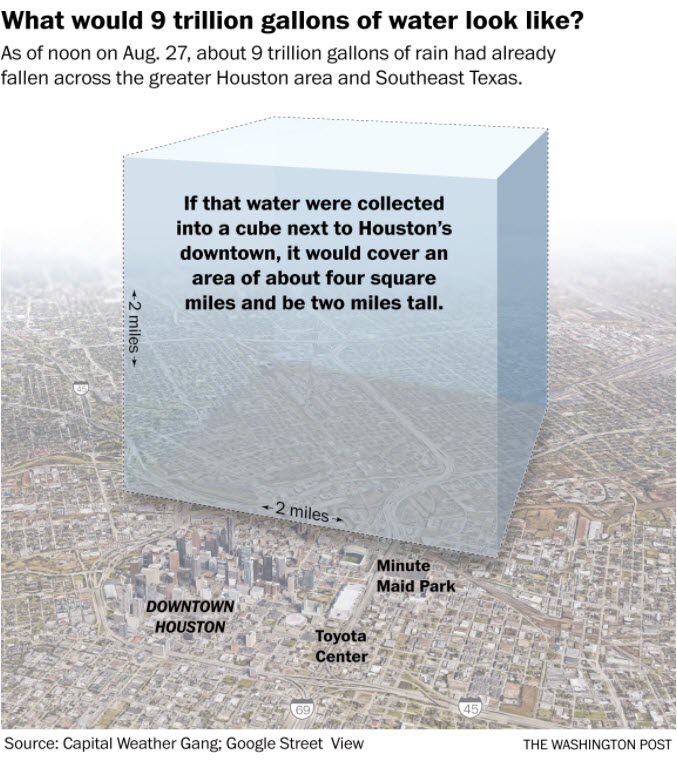
Note: The graphic below is from Matthew Cappucci’s article published in The Washington Post, Texas flood disaster: Harvey has unloaded 9 trillion gallons of water. Detailed source notes and a link to the article are provided at the end of this blog post.
What Would 9 Trillion Gallons of Water Look Like? [3]
Note: The numbers below are from Kristin Musulin from her article in SmartCitiesDIVE, The 500-year storm: Quantifying Harvey’s destruction. Detailed source notes and a link to the article are provided at the end of this blog post.
Quantifying the damage, and assessing remediation [1]
Here are the impacts that the hurricane has had on community health, safety, waste, energy, transportation, construction and communication in Southeast Texas and other affected areas since Harvey made landfall on Aug. 25.
Health and safety
- There have been nearly 40 confirmed and suspected flood-related deaths.
- About two dozen area hospitals remained closed as of Aug. 30.
- Health insurance companies have been asked by the state “not to deny or assess penalties for out-of-network claims from healthcare services sought during the state-declared emergency and to delay their filing deadlines,” according to Healthcare Dive.
- Nearly 35,000 people have taken refugee in 231 shelters.
- Dallas has prepared to host “thousands upon thousands upon thousands” of Houston evacuees.
Construction and transportation
- An estimated 30,000 to 40,000 homes have been destroyed.
- More than half of Houston’s residential and commercial properties that are at high or moderate risk of flooding are not in the Federal Emergency Management Agency’s Special Flood Hazard Areas, meaning most do not have flood insurance.
- Some roads are showing signs of potential collapse, while other roads have been closed due to sinkholes.
- Up to 500,000 vehicles have been ruined, marking the greatest car wreckage in U.S. history.
Waste management
- Houston-area companies like Waste Management are preparing for what could be a years-long cleanup effort.
- Trash pickup resumed Aug. 31 to kickstart the debris removal process.
Energy, oil and gas
- 294,000 people from Corpus Christi to Port Arthur remain without power as of Aug. 31.
- 22% of the U.S. refining capacity is now offline.
- National average gas prices have climbed 3%, and are expected to continue increasing.
- At least 2 million pounds of pollutants have been released from oil refineries and chemical plants.
- A 1.5-mile radius in the town of Crosby has been evacuated due to flood-related explosions at an Arkema chemical plant.
Communication
- The FCC reported on Aug. 29 that 283,593 wireline telecom or cable service customers across Texas and Louisiana were out of service and 15 public safety answering point (PSAP) experienced outages.
- AT&T deployed two charging stations, seven portable cell sites and an emergency communications vehicle to the affected areas.
- Due to power outages and spotty service, many affected residents turned to Twitter and Facebook to call for help.
Where does Houston go from here?
After making a second landfall on Port Arthur, TX, the wrath of Harvey is beginning to die out. Unaffected cities may take a sigh of relief, but now is not the time for coastal cities to relax. In fact, a new storm is brewing.
Hurricane Irma has formed in the Atlantic Ocean with potential to become a Category 4 storm according to USA Today. While the National Weather Service is unclear of Irma’s exact path, many wonder: Will history repeat itself?
As climate activists and skeptics debate if Harvey was the result of climate change, it is undeniable that the effects of Harvey were unprecedented, indicating a new level of reality that cities could face if hit with a similar hurricane. Resilience strategies, both for disaster prevention and remediation, need to be discussed in all smart cities — and actively put into place. As Scott Tew of Ingersoll Rand recently told Smart Cities Dive, “You can’t do this day of or week of.”
Note: The graphics and verbiage below are from an article by Denise Lu, Aaron Williams, Dan Keating, Jack Gillum and Laris Karklis, Houston’s floodwaters are receding, but they remain dangerously high in many areas, that was published in The Washington Post. Detailed source notes and a link to the article are provided at the end of this blog post.
Houston’s floodwaters are receding, but they remain dangerously high in many areas [2]
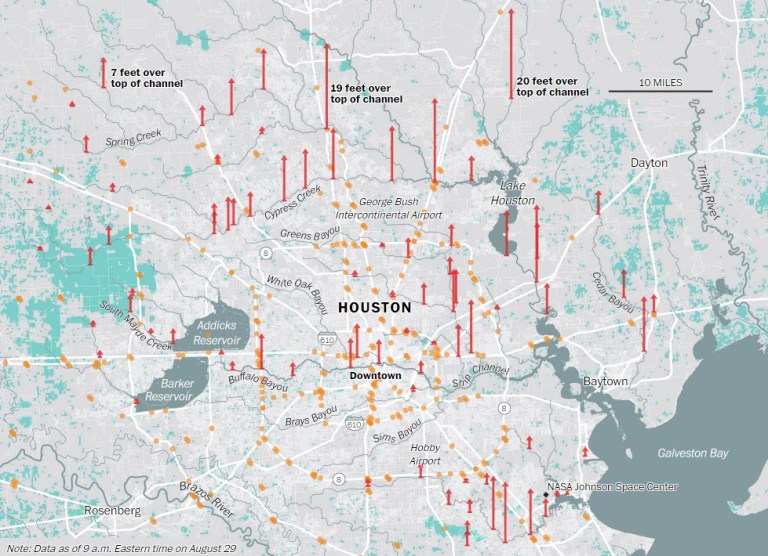
The Houston region’s flood control channels withstood the rains last Saturday, with only 3 out of 150 gauges flooded when the sun went down. But by sunrise last Sunday, a majority of the 150 stations were underwater. Flooding worsened all day Sunday until the predawn peak Monday when more than two-thirds of the flood channels were under sheets of rainwater.
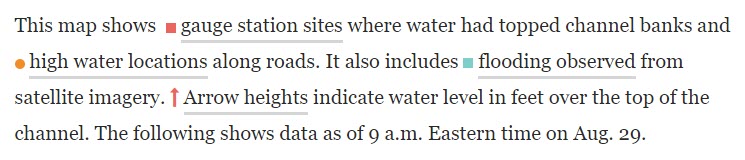
Harris County strategically placed gauge station channels — ranging from two to 40 feet deep — to measure water levels from rainfall and hurricanes. Arrow heights indicate water levels exceed the top of the channel and circles represent the peak flood level of a channel.

The northwest section of downtown suffered less flooding and drained more quickly. At worst, half of the channel measurements showed flooding on bayous flowing east toward Lake Houston. By late Wednesday, the only flooding in that area was at Addicks Reservoir. Further north Cypress and Spring creeks had 10 to 20 feet of floodwater from Sunday through Tuesday. Only on Wednesday did half of the measurements show water contained within the channels. Some measurements in that sprawling region of 1.5 million people are hazy, however, because gauges were damaged by the flooding and are stuck at the greatest depths.
On Monday evening, every channel in the northeast section of Houston showed flooding from portions of Greens Bayou, Hunting Bayou and the San Jacinto River. The neighborhoods are not as dense as other portions of the city but house a greater share of the African American and immigrant communities. By Wednesday, all water downtown was contained in the drainage channels.
The south sections of downtown have been consistently flooded by Buffalo Bayou with several feet of floodwater Wednesday night. The growing portion of the city has about 1.4 million people including a mix of upscale and inexpensive housing. Flooding further south along Brays Bayou dropped on Tuesday and was within the channel on Wednesday. Further south along Clear Creek in Brazoria County, floodwaters remained several feet deep Wednesday afternoon in the region of about 1.2 million people.
Measuring the storm [2]
As of Tuesday, agencies such as the National Weather Service provided estimates for total rainfall and flooding, and local agencies such as Houston TranStar provided data on road closures. Yet the volatile and ongoing nature of the storm makes it difficult to map the extent of flooding in the region.
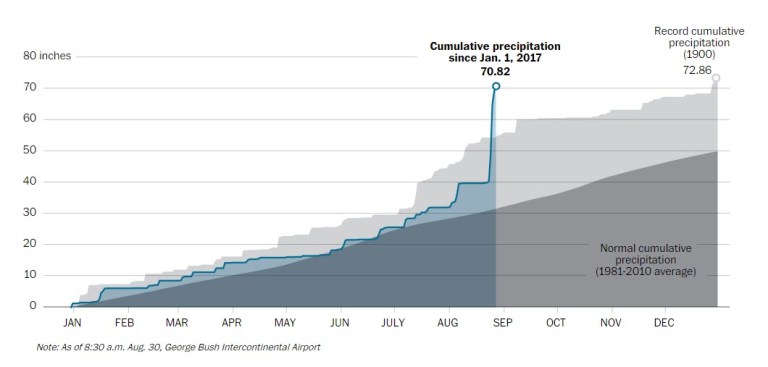
Record Levels of Rainfall in Houston [2]
Source:
[1] Musulin, Kristin, The 500-year storm: Quantifying Harvey’s destruction, SmartCitiesDIVE, August 31, 2017, http://www.smartcitiesdive.com/news/the-500-year-storm-quantifying-harveys-destruction/503893/.
[2] Denise Lu, Aaron Williams, Dan Keating, Jack Gillum and Laris Karklis, Houston’s floodwaters are receding, but they remain dangerously high in many areas, The Washington Post, September 1, 2017, https://www.washingtonpost.com/graphics/2017/national/harvey-houston-flooding/?%3Ftid%3D=sm_pg&utm_term=.16868f116e81.
[3] Cappucci, Matthew, Texas flood disaster: Harvey has unloaded 9 trillion gallons of water, The Washington Post, August 27, 2017, https://www.washingtonpost.com/news/capital-weather-gang/wp/2017/08/27/texas-flood-disaster-harvey-has-unloaded-9-trillion-tons-of-water/?utm_term=.6d50cabc7b26.

Hi Michael,
This is a very nice and informative article. Thanks for creating and sharing it. Being a hydrologist that has been working extensively on climate change (https://3danim8.wordpress.com/climate-change-quantified/), I have been realizing how important these types of articles are for all of us to see and comprehend.
Ken
Thanks, Ken. I hope all is well in your world. Good to hear from you!