Readers:
Recently I participated in the MOOC, Data Exploration and Storytelling: Finding Stories in Data with Exploratory Analysis and Visualization which was taught by Alberto Cairo and Heather Krause. This course was a MOOC-style course from the Knight Center for Journalism in the Americas at The University of Texas – Austin.

I have previously attend two other MOOC courses taught by Professor Cairo and gained a lot of knowledge from those courses as well as inspiration and excitement in my work environment.
I really, really loved this course and wanted to provide some feedback and information for those of you considering taking this course (or a future course) from Alberto and Heather.
I like to ruminate about what I will write versus rushing to get it all in one long blog post, so I will be doing this as several blog posts. Please have patience with me as I want to provide as much information and thoughts as possible about why this was a great course.
I need to, for full disclosure, state that I am not a journalist. I am a Business Intelligence Data Architect by title, but really consider myself a seasoned programmer (with lots of experience in many programming languages, scripting languages and BI Toolsets). Currently, my primary BI toolset is Tableau Desktop v10.2.
I hope you find this review helpful and I highly encourage you to take courses not only from them, but other offerings in the MOOC space.
Best Regards,
Michael
Goals and Objectives
Goals
The primary goal of the course was to introduce the participants to ways to use data as a source to tell stories. Throughout the course, Mr. Cairo and Ms. Krause demonstrated, via the videos, the tools and techniques they commonly use to interrogate data for answers – gathering, cleaning, organizing, analyzing, visualizing and publishing data to find and tell stories.
I will touch on some examples of these tools and techniques throughout the series of blog posts for this review.
Objectives
The objective of the course was for the participants to come away with knowledge about the following topics.
• How to find data
• How to understand the data you want to work with
• How to build stories with data using several variables or pieces of data at the same time
• How to implement best practices around ethics and data
Course Format
This course is referred to in the syllabus as “an asynchronous course.” Again, per the syllabus, “that means there are no live events scheduled at specific times. You can log in to the course and complete activities throughout the week at your own pace, at the times and on the days that are most convenient for you.” [1]
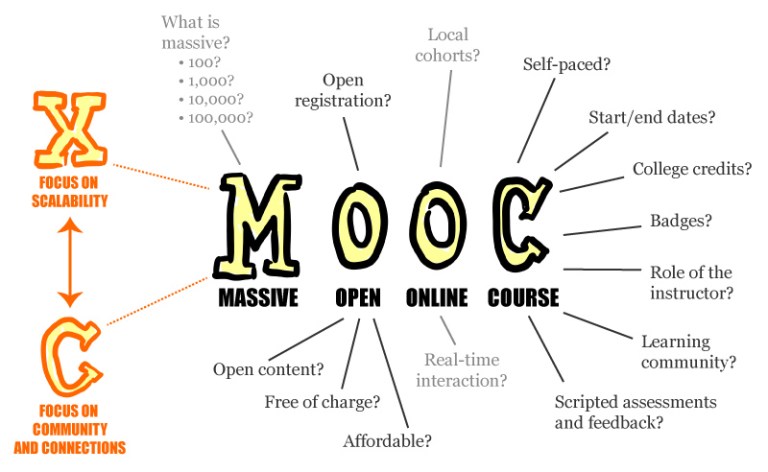
Courses like this are referred to as a MOOC. A Massive Open Online Course (MOOC) is an online course aimed at unlimited participation and open access via the web. In addition to traditional course materials such as filmed lectures, readings, and problem sets, many MOOCs provide interactive user forums to support community interactions among students, professors, and teaching assistants (TAs). MOOCs are a recent and widely researched development in distance education which were first introduced in 2006 and emerged as a popular mode of learning in 2012. [3]
In the poster below, titled “MOOC, every letter is negotiable”, explores the meaning of the words “Massive Open Online Course”. [4]
Instructors [2]
 Alberto Cairo is the Knight Chair in Visual Journalism at the University of Miami. He’s also director of the Visualization program at UM’s Center for Computational Science. For more than a decade, Cairo was an infographics director at publications in Spain in Brazil, like El Mundo and Globo magazines. Today, besides being a professor, he works as a consultant and designer for news organizations and for companies like Google and Microsoft. He’s the author of the books The Functional Art: An Introduction to Information Graphics and Visualization (2012), and The Truthful Art: Data, Charts, and Maps for Communication (2016).
 Heather Krause is a data scientist with years of working on complex research problems in the social, non-profit, and data journalism sectors. She is passionate about helping people understand and use the best practices and tools to transform data into rich stories. Heather has worked on many complex stories that mix math, science and creativity into comprehensive narratives and data journalism pieces. As the founder and president of Datassist she has worked with FiveThirtyEight, Orb Media, the Bill and Melinda Gates Foundation, Syrian Refugee Resettlement Secretariat, and many more international non-profit organizations.
Course Content
The course consisted of six modules. Each module (videos, reading, exercises, discussion forum, quiz) was expected to be completed in a week. The six modules were:
Module 1: Finding and Understanding Data
Module 2: Character Development for your Data Story
Module 3: Basic Plot Elements of Your Story
Module 4: Advancing the Plot of Your Story
Module 5: The Plot Thickens in your Data Story
Module 6: Putting the Data Story Together
Next Blog Post: Review of each of the modules
Sources:
[1] Alberto Cairo and Heather Krause, Course Syllabus: “Data Exploration and Storytelling: Finding Stories in Data with Exploratory Analysis and Visualization“, Knight Center for Journalism in the Americas, The University of Texas – Austin, January 16–February 26, 2017.
[2] Alberto Cairo and Heather Krause, Biography Photos and Introduction, Knight Center for Journalism in the Americas, The University of Texas – Austin, DES17 – Introduction, http://journalismcourses.org/course/view.php?id=47§ion=1.
[3] Wikipedia.com, Massive open online course.
[4] Mathieu Plourde, “MOOC, every letter is negotiable”, April 4, 2013, licensed CC-BY on Flickr, http://www.flickr.com/photos/mathplourde/8620174342/sizes/l/in/photostream/.
