Readers:
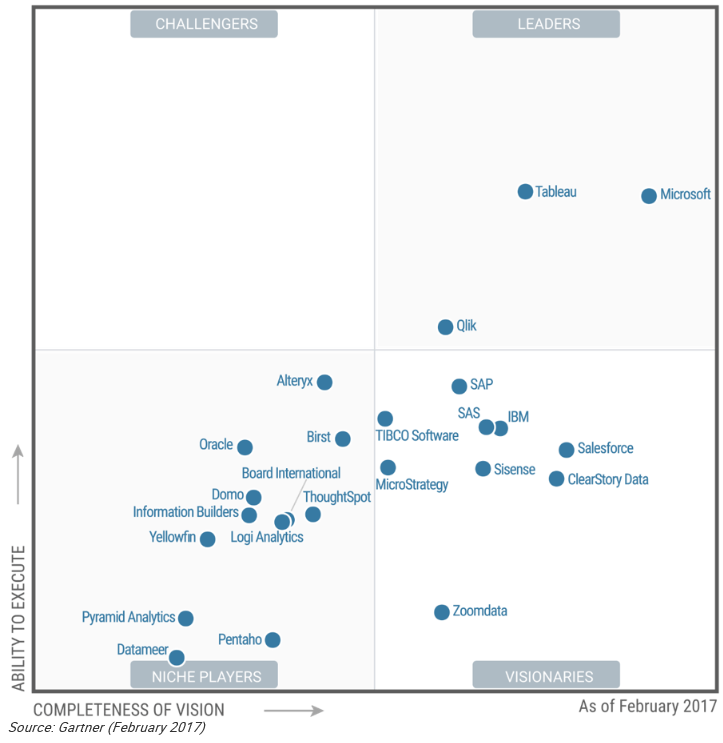
Around this time every year, friends and colleagues start e-mailing me images (see above) of the 2017 Gartner BI and Analytics Magic Quadrant (referred to as the MQ). In the past, when I worked extensively with MicroStrategy, my colleagues would complain how IBM (nee Cognos) was ranked ahead of it. For the last two years, my friends in the Tableau community are scratching their heads on how Microsoft Power BI ranked ahead of Tableau in completeness of vision. Grumbles throughout the BI & Analytics industry range from “The Gartner folks don’t know what they are talking about” to “well, you know, Microsoft owns a piece of Gartner.”
*Sigh*
Personally, I have had excellent conversations in the past with Kurt Schlegel and Cindi Howson from Gartner. I found both of them to be fairly reasonable and honest people.
 Today, Cindi Howson (photo, right) posted on the Gartner Blog, Biggest Mistakes To Avoid When Reading the Magic Quadrant. In this post, Cindi acknowledges both the anxiety and anticipation BI & Analytics industry folks had waiting for this year’s MQ to be published.
However, Cindi notes that there are some key mistakes people make when viewing the MQ image by itself.
Assuming “ability to execute” is about ability and future ability.
Per C![]() indi, the placement along the Y- axis (see example to the left) is labeled Ability to Execute (A2E). She says you should mentally visualize this as a combination of product capabilities, financials, and operational excellence. Strictly looking at how a vendor did in the previous year is not indicative of how much “ability” they will have in the future. Also, a mediocre product that rates well in other areas, may end up with a high placement on the A2E axis. Also, you could have a great product with terrible customer support which still has a high end result.
indi, the placement along the Y- axis (see example to the left) is labeled Ability to Execute (A2E). She says you should mentally visualize this as a combination of product capabilities, financials, and operational excellence. Strictly looking at how a vendor did in the previous year is not indicative of how much “ability” they will have in the future. Also, a mediocre product that rates well in other areas, may end up with a high placement on the A2E axis. Also, you could have a great product with terrible customer support which still has a high end result.
Cindi states, “Being average across the board rarely lands a vendor in the top half of the Quadrant, whether Leader or Challenger.”
Assuming “completeness of vision” is only the product roadmap.
![]()

Cindi notes, “The placement along the X-axis (see example above) does include the vendor’s vision, or roadmap, but it also includes a number of other factors such as market understanding as well as strategy on marketing and vertical solutions.”
Even if a vendor has a great roadmap, if they are not exceeding in other strategic factors, they will often end up in the Niche or Challengers Quadrant.
The Gartner BI and Analytics MQ team defines “market understanding” as a combination of ease of use and complexity of data and analysis, because that is what is driving new buying requirements.
 Looking only at the picture.
“A picture is worth a thousand words” is an English idiom. It refers to the notion that a complex idea can be conveyed with just a single still image or that an image of a subject conveys its meaning or essence more effectively than a description does.
Notice the image on the right. It just shows the dots. Pretty meaningless without more information. Right?
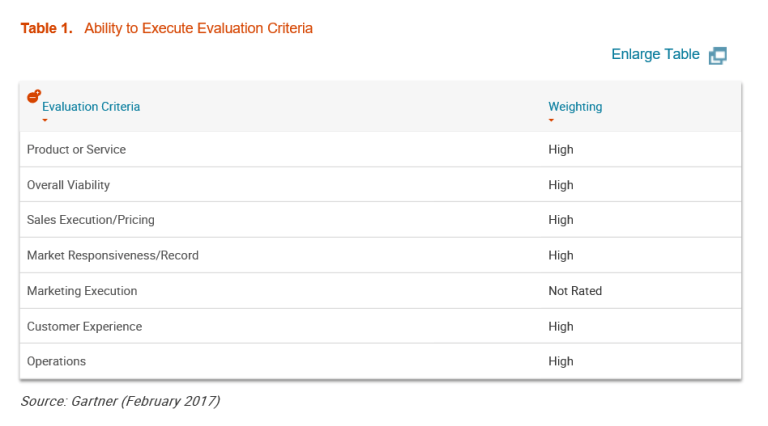
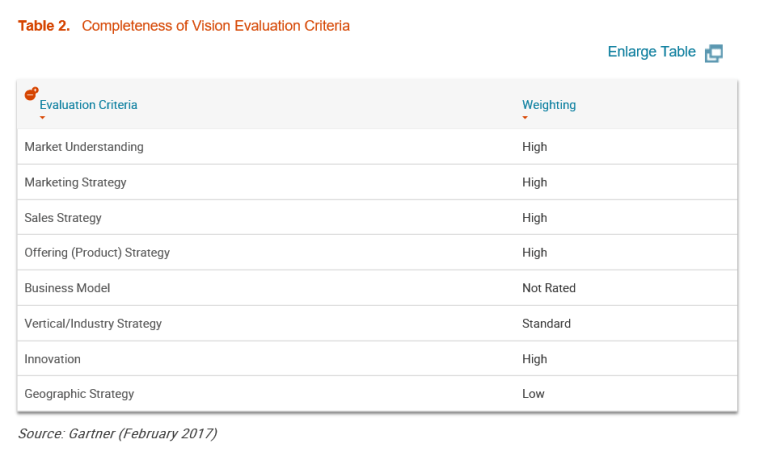
Cindi talks about needing to read the fine print while viewing the MQ. She cites Tables 1 and 2 of this MQ (I have provided screenshots of them below).
Cindi notes, “When something doesn’t make sense to me or when the model first generates the graphic, I have to remind myself of the six to eight drivers that go into each axis.”
Using only the MQ.
Cindi states it best when she says, “If you rely only on the MQ to set your BI and analytics strategy, you are making a mistake. If you only look at the Leaders, you also are making a mistake; the best vendor for your particular requirements— short term and long-term— may be in another quadrant or not in the MQ at all. The MQ is just one resource. We have the companion Critical Capabilities which focuses on the product only (new version due out soon), the market guides, the cool vendors, and so many toolkits. Use the full body of research when buying products and setting strategy. Better yet, set up an inquiry call so we can guide you through the process. It’s what we are here for, and there are a lot of us!”
I hope you found Cindi’s comments helpful in how you view the MQ. I don’t always agree with the Gartner findings, but they put a lot of effort in creating these every year and it is at least a solid baseline for us to do our own objective evaluation of the tools based on our business requirements. And remember, A fool with a tool is still a fool.
Best Regards,
Michael
Sources:

Just came across this post while looking for something else and I have to say…WOW! I thought given the title you would actually call out the irony of Gartner’s folly. The new thing in our industry is data visualization. Yet if you want to get to the “truth” you have to dig 7 layers deep and go to multiple locations to get the “Rest of the Story”. you are funny about Gartner being honest; I used to work for Oracle, believe me when I tell you the best used car salesmen there, like the Gartner folks, can make you believe black is white and they will have you thanking them for helping you understand your error.
The Irony…If this is about Data visualization…shouldn’t I be able to ascertain the gist of the entire picture from one graphic? Remember the Yugo Car? If I cherry pick the right metrics, I can show you in an MQ that they are a much better car than Mercedes. The Critical Capabilities Report is just Cindi’s delusional way justifying her existence. It is how she sleeps at night. The Proof…5 months ago my company decided to make a move towards Microsoft Power BI because of the MQ. I pointed out the narratives in the MQ as well as I showed them the Critical Capabilities Report (CCR). The message between the MQ and the CCR were so out of sync, one of my executive actually accused me of professional dishonesty and said I was just trying to justify keeping our current BI Tool. AND the icing on the cake…A Gartner rep told another executive that we would be better off using just using the MQ.
So Yes, I have to agree with you, Gartner is a pure and honest as the wind driven snow! (Remember I was one of those Oracle guys)