
Adam Green Bio
I’m a senior data & visualisation developer and team lead at Jisc, however I wasn’t always a dataviz nerd. I started life as a music nerd! I studied for a BA in Music and fell in love with the analysis of music, a catalyst being the serial music of Schoenberg. Transfixed by a mathematical and data driven approach to composition, I continued my study of music in a Master of Music by research in Electro acoustic composition and sonic arts (a mouthful right!). In short, I developed AI systems to improvise with. My live improv buddy captured data from my trumpet in real time, sampling and transforming audio to play with in a live performance setting. As fun and creative as this was, I moved on from generating data to analysing data for universities and have never really looked back.
In my working career, I have been lucky enough to build an analytical unit from ground up and foster data driven decision making across the business through Tableau server enterprise wide implementations. Two years ago, I decided to move my game to ‘sector level’ and work with many higher education providers, further education providers and sector agencies at not for profit ‘Jisc’ where I get to build data analytics competencies and services across the sector.
Outside work, I’m kept busy by my fun and energetic family (wife and two great kiddies). We live in the beautiful Norfolk broads (UK) and spend most of our time outdoors, playing about in water (rivers or sea), walking, running, or out and about with the ponies.
QUESTION
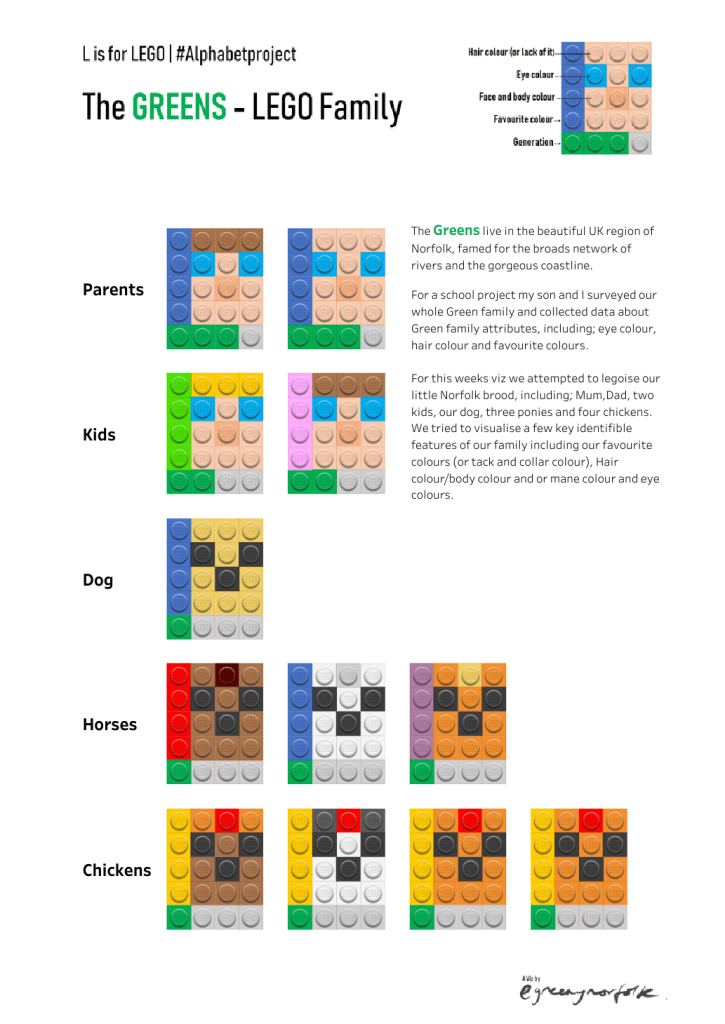
Link: https://public.tableau.com/profile/adam.green4310#!/vizhome/LisforLego/LisforLEGO
Michael: Hello, Adam. Can you tell my readers about you #CoffeeTableViz blog, and in particular, the #AlphabetProject?
Blog Link: https://coffeetableviz.wordpress.com/
Adam:
#Coffeetableviz is a place for me to share my vizzes I’ve made in Tableau, I provide a bit of background to the dashboard and I write a short and snappy ‘how to’ for readers (if they wish to unpick the construction of the viz).
In addition to keeping up with Cole Knaflic superb Story telling with data challenges, Makeovermonday (to help hone those rapid prototype development and analytical skills), various ‘data that interests me’ Data viz projects, VisualisingHE where I and a few fellow HE enthusiasts viz open higher education datasets, In 2020 the wonderful Laura Sandford and I kicked off a project called the #Alphabetproject.
I am totally loving this project!
We each set a theme on alternate weeks based upon the next letter of the alphabet, for example: ‘A is for Artist’ and ‘B is for Beer’…. We are currently working on the letter ‘O for Olympians’. We had a great start to the project when my A for Artist viz popped in for stint on #VOTD in week one of the project. More recently my partner in crime Laura nailed a viz in our ‘K is for King’ where she visualised the Martin Luther King speech. Keep up with our project here on my blog or Laura’s creations here.

Michael: You work for Jisc. Can you discuss how you use Tableau in your current role and a little bit about what you do there?
Adam:
At Jisc, we work in partnership with the UK’s research and education communities to develop the digital technologies they need to teach, discover and thrive.
I work in the data and analytics directorate and my role focuses on two key projects. I work with university analysts from the sector in short, 3-month continuing professional development projects which aim to develop competencies in agile development, visualising data (Tableau), transforming data (Alteryx), digital collaboration and further understanding UK HE policy and the ever-changing data landscape. The second strand to my work is as a Senior developer and team lead. I lead a team of developers to create hosted Tableau dashboards which are codesigned with the sector to answer pertinent and timely strategic questions.
Michael: Can you tell me your three favorite Tableau tips and tricks?
Adam:
- Auto Deselect marks – For a better UX I was alerted to a great blog post by Luke Stanke to overcome the deselection of marks when you select an element within a viz (to stop it from doing that ugly grey out thing Tableau does when you select something) – blog – I love this tip and use it quite a lot.
- Peer review (not specifically a Tableau top tip rather a data viz top tip) I think it is so important to give your viz a dry run with your peers, the Tableau community is fantastic, reach out and seek feedback, people are more willing than you think to provide value feedback on your creation.
- Check your phone layout (and fix or remove) before publishing to Tableau Public!
Michael: What is next on your “To Do” list? What can the Tableau community expect to see from you in the near future?
Adam:
Next on my to do list:
Every day is a learning day! Tableau evolves with every version in a way not like any other software. The community is so creative and comes up with new hacks and creations every day. With a project like the Alphabet project it allows me to keep sharp and evolve and try something new every other week. I love to learn and strive to keep honing my data viz craft.
So What’s next…? More fun, more learning, more vizzes and more blogs.
Thanks Michael for the opportunity to share a sneak peek into Adams world 😊
Tableau Public
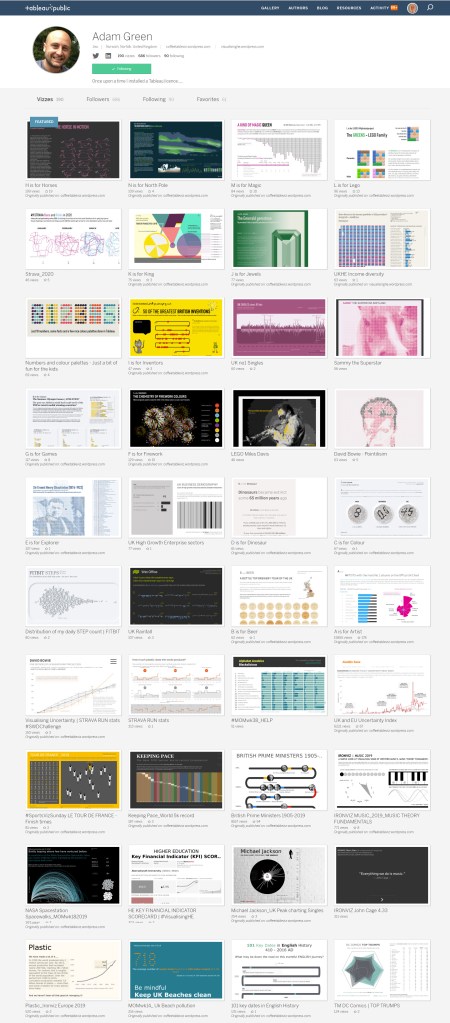
Below is a small sample of Adam’s great dataviz work on Tableau Public.
Link: https://public.tableau.com/profile/adam.green4310#!/?newProfile=&activeTab=0

thanks