Zunaira Rasheed Bio
INTRODUCING ZUNAIRA RASHEED!
I was born and raised in Lahore, Pakistan. Almost everyone from Lahore is a self-proclaimed foodie because of the fantastic street food and regional traditional dishes. I am no exception. Weird food fact about me is that my spice tolerance level is very high (gladly take a spice challenge) whereas my sweet tolerance level is very low (cannot consume more than a couple of bites of anything sweet). I probably still have leftovers of very delicious brownies in my fridge that my friend baked for me a month ago.

I am self taught in pretty much everything I have been doing professionally for the past 5-6 years. I was lucky to start my career at IBM that fosters a culture of learning and development. I started my career as a support consultant and in a couple of years developed interest in knowing what my techie colleagues were doing. Out of curiosity, I started to learn about databases and SQL, eventually moving towards the analytics domain as I kept upskilling and reskilling. It involved a lot of after office hours and help from very supportive colleagues. However, all that work has been worth it.
I am a ridiculously quiet person, more often than not you would find me struggling to start a conversation. Thank you to all those who have been kind enough to bear with it. I was always that shy kid in school. This is why I try to challenge myself in to situations that are uncomfortable, while drowning out the screams of the introvert inside me. Fake it till you make it, I guess.
I have recently moved to Basel to pursue an opportunity. This has taken me completely out of my comfort zone and is taking my career in a completely different direction than what I had planned and I could not be more excited to see where this new path takes me.
QUESTIONS

Michael: Hello, Zunaira. I really like your Domestic Violence dataviz that you created for #MakeoverMonday this past March. This is an important topic and I think you have offered an important and interesting look into this topic. Can you talk about how you designed and developed this dataviz? Also, can you also walk my readers through how to view and use this dataviz?
Zunaira:
On my way to office a couple of years back in Lahore, I was waiting at a traffic signal while being approached by multiple street beggars as per usual. Then a woman came up to the window asking for money, she must have been in her early 20s. Her entire forearm was completely burned, the skin was nonexistent and the flesh was completely exposed. When I asked her what happened she said ‘Baji, meray shohar ne mughe jala diya’ (Baji (sister) my husband burnt me). I know that at the end of the she would have gone back home to the same man who treated her inhumanely. Why? The answer to his question is complicated and tied to many factors. To list a few, more often than not the parents are not in a financial position to take care of their daughters so they send them back, these women have not been provided proper education or taught skills enough to provide for themselves, loopholes in the legal system makes it hard for them to get justice.
I have seen other victims of domestic abuse first hand and have heard stories about many others. When working on this dataset my emotions got the best of me and I did not produce the kind of viz that I wanted to. I feel I have not done justice to the data.
My frustration during the making of the viz came from the fact that acceptability of domestic violence is a very multifaceted problem and education is just one factor. Among many other factors, when male patriarchy is deeply rooted in a society and there is little or no legal consequences for the perpetrator, then suffering through domestic violence is the only way of life the victims know. I tried to incorporate these factors in my viz by listing the various reasons that perpetuate domestic violence, taken from UNICEF research and publications.
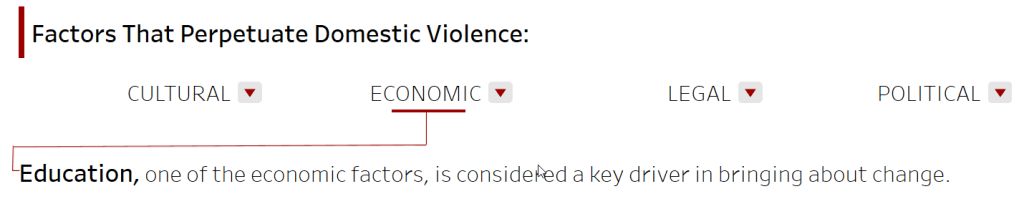
Clicking on the arrows next to each factor shows a detailed breakdown and as you can see, lack of education is just one factor. Education is a key driver for change, but it alone is not enough. My viz shows only the tip of the iceberg.
I tried a few different approaches to show the impact of education on acceptability of domestic violence. After a few iterations, I felt that comet charts worked best in this scenario as they clearly show the impact. The tail represents ‘no education’ and the head represents the level of education as you click through the educational timeline. The direction and the color of the comets indicates the decrease or increase of acceptability.
As I said, there is a lot more that I can do with this. Maybe one day I will go back to this one and try to do it justice.

Michael: You live in Basel, Switzerland. It is a really beautiful city. Can you tell me some places to visit if I were to be in Basel?
Zunaira:
A walk around Rhine river which is the heart of Basel. Definitely take a ferry across the Rhine. It is very small trip but the interesting part is the ferry, which is solely powered by the current of the water and thus makes for a quiet and leisurely trip.

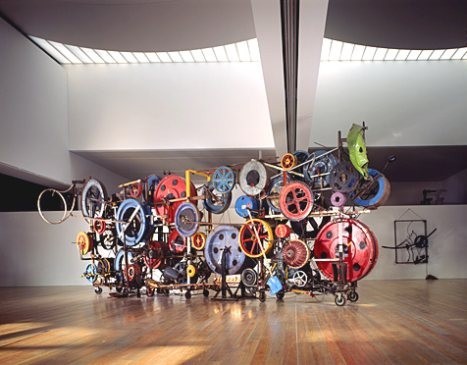
There are about 40 museums in this small city. I would suggest a visit to Museum Tinguely, which is the most interactive museum I have been to. It has a collection of animated sculptures by a Swiss sculptor Jean Tinguely and almost all of them can be activated with a button. It is a bizarre yet interesting experience, well worth a visit.
Swiss cheese should be a mandatory part of your trip. I have really enjoyed Raclette dinner where Raclette cheese is melted in special small pans and then scrapped off on top of bread, potatoes or other accompaniments.
Michael: Can you tell me your three favorite Tableau tips and tricks?
Zunaira:
I am not a fan of stacked bar charts but I often encounter them at work. My favorite way of making stacked bars easier to read is by giving users the control to sort the stacks. This allows them to view each category along the zero baseline. I learned this fantastic tip from Adam Crahen (@acrahen) course on PluralSight.
https://www.pluralsight.com/courses/tableau-desktop-building-common-chart-types-playbook
One thing that I have recently consciously started to do is to use the ‘Comment’ option with calculated fields. I try to add very specific explanation of the calculation in the comment. This helps quickly recall the purpose of the calculation especially when you open up a workbook after sometime. It also helps others understand and use your workbook.
Lastly, I extensively use viz in tooltip when creating dashboards at work. I think it is a very clever way adding more data and additional context without cluttering the main dashboard.
Michael: In your Twitter profile, you state that you are “very specific about tea.” Can you tell my readers a bit about this?
Zunaira:
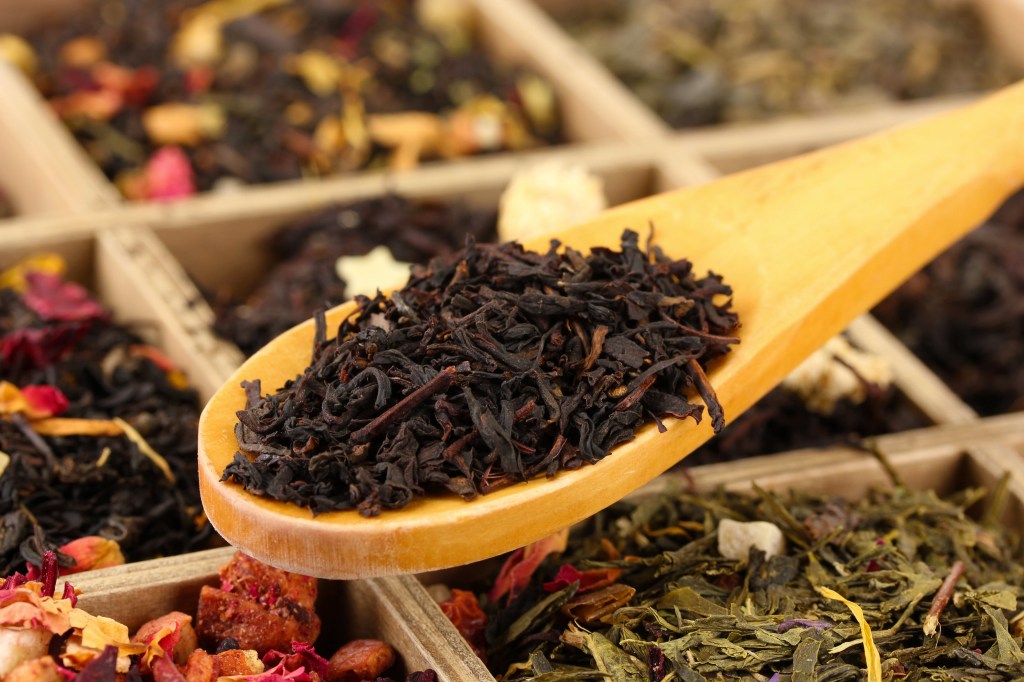
I have a funny story that indicates my level of obsession. In my previous organization, we had a staff member who was responsible for employee’s tea and food arrangements. We all call him ‘Chaudhry Sahab’ (sahab is term of respect for elders), who has been working there for more than 30 years. The kitchen was his territory where he made tea and coffee for us the way he wanted to, not the way we wanted. Sure you could go make it yourself, if you can handle his disapproving stares. Let us just say that he was not very open to feedback and we all lovingly went along with it. I, on the other hand, did not give up because I simply cannot function without a few good cups a day. I spent weeks trying to convince him to make my tea the way I wanted. The water needs to be boiled for a specific time, tea should be of a specific brand (which he was already using), it needs to be brewed for a specific time, milk should be added in specific quantity depending on whether it is a whitener or liquid and lastly the mug should be very hot before tea is poured in to it.
He eventually gave in and I got the tea I wanted. It quickly became a joke among my colleagues on how fussy I am and how lucky I am that Chaudhry Sahab listened.
He is probably the most popular, loved, and respected staff member there and I do really miss his tea. This is my ‘goodbye selfie’ with him.
Michael: What is next on your “To Do” list? What can the Tableau community expect to see from you in the near future?
Zunaira:
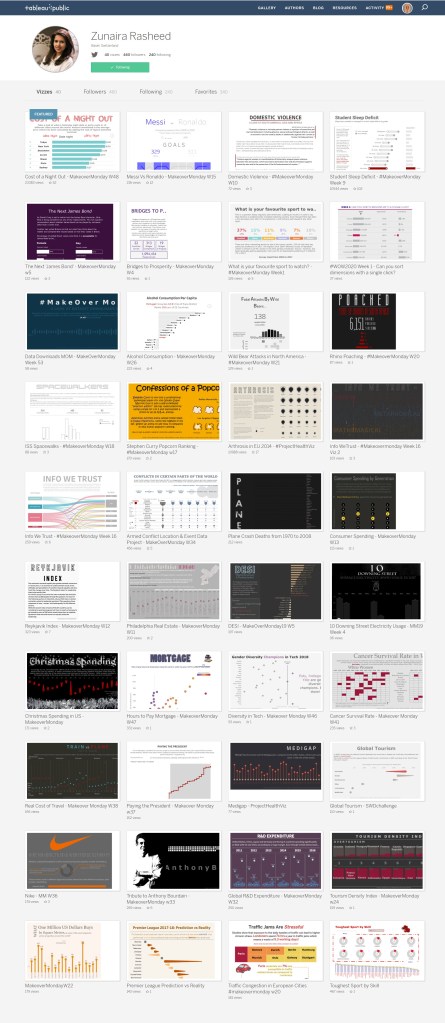
It is evident from my Tableau Public portfolio that I have not been very active in the past many months. One major reason is that my move to Basel and the settling in process has been very challenging for me personally. It has taken up a lot of my energy. I also have a serious case of impostor syndrome that I have not been able to get past. Something that used to be fun has now become a source of excessive self-criticism. Thankfully, some great one-on-one conversations with a few members of the community is helping me get my confidence back.
I have thoroughly loved vizzing publicly and I will get back to it soon.
Tableau Public
Link: https://public.tableau.com/profile/zunaira.rasheed#!/