I was late at getting started on this, but looked at a lot of other folk’s examples via Twitter over the week. Lots of creative juices flowing out there.
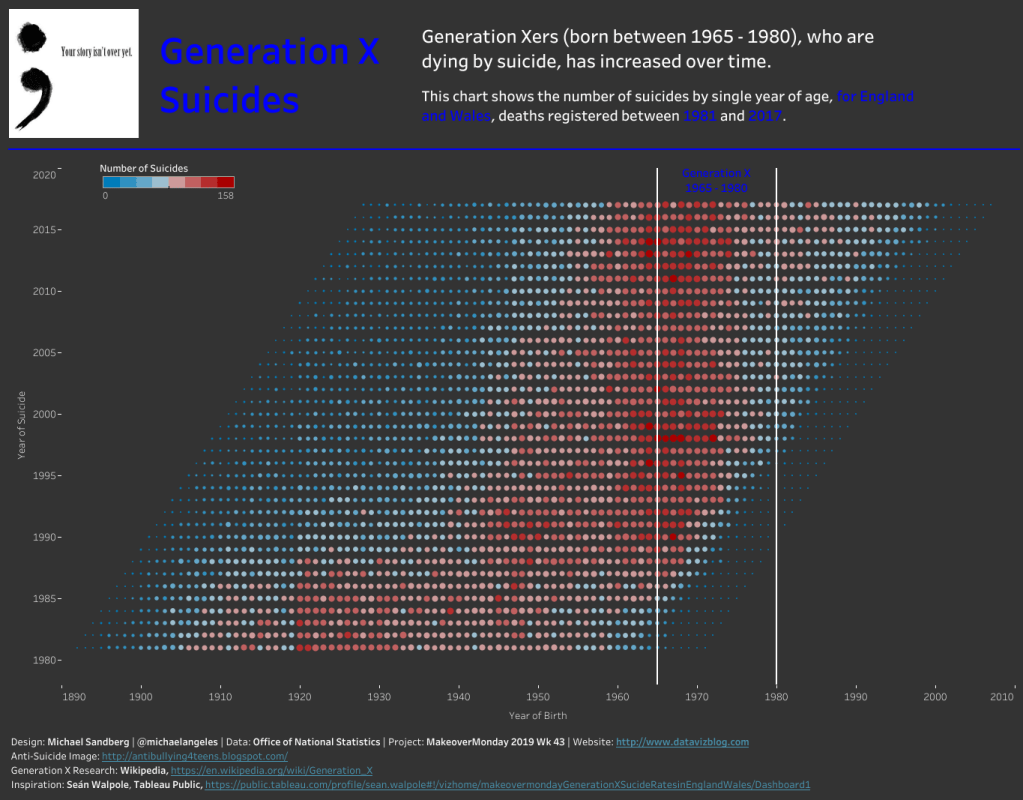
I saw several datavizzes that followed a format similar to what I used, and based mine on one created by Sean Walpole. I like how Sean showed the increase in suicides visually, and modeled mine after his example. I stretched out the chart more to give each circle more room and definition, which I feel helped in analyzing the chart. I also added a title, and changed my Generation X dates to 1965-1980 per some research I did on Wikipedia.
Suicide is a serious matter. If you or anyone you know is thinking of committing suicide, please, please call the National Suicide Prevention Hotline at 1-800-273-8255. I care.

Here is the link to my dataviz for this week on Tableau Public.