I just completed my #MakeOverMonday 2019.28 entry.
Here is the link to it on Tableau Public.
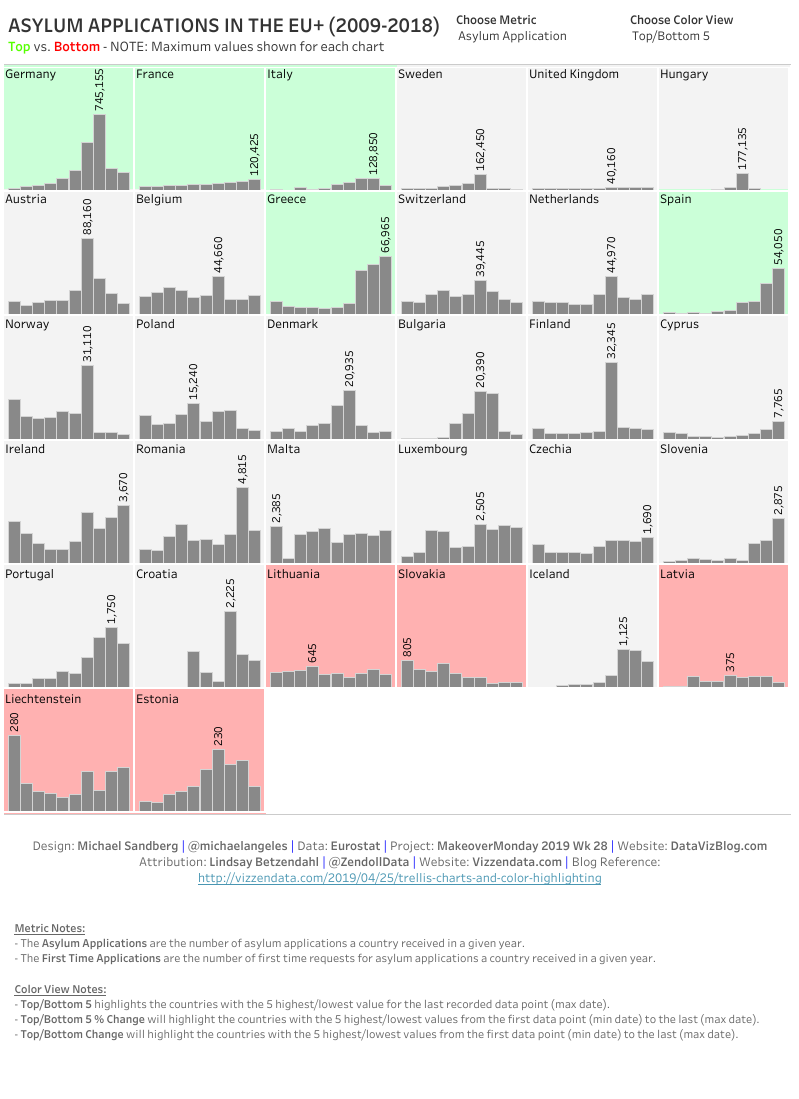
I was very focused this week. After reviewing the data, I decided I wanted to try to create this as a Trellis Chart. I looked at several trellis chart examples on Tableau Public, and decided to use one created by Lindsay Betzendahl as my template.
Attribution to Lindsay Betzendahl (@ZendollData). The “How Tos” for creating this chart can be found on Lindsay’s website here.
I also give Lindsay attribution at the bottom of my data visualization.
That’s it for this week!