
Tableau 2019.3 Beta was announced at the Tableau Conference in Berlin this past week.
Here are a few of the new features coming soon.
Explain Data
Explain Data gives you explanations for unexpected values in your data with a single click. Available as you’re creating a viz or dashboard, Explain Data uses powerful Bayesian methods to surface statistically significant explanations. Behind the scenes, hundreds of potential explanations are checked and the most likely ones are surfaced. Every explanation is a viz, and can be explored with the full power of Tableau. This not only saves you time, as it brings you to the why quickly, but you can discover insights you didn’t know existed, and easily access and explore explanations.
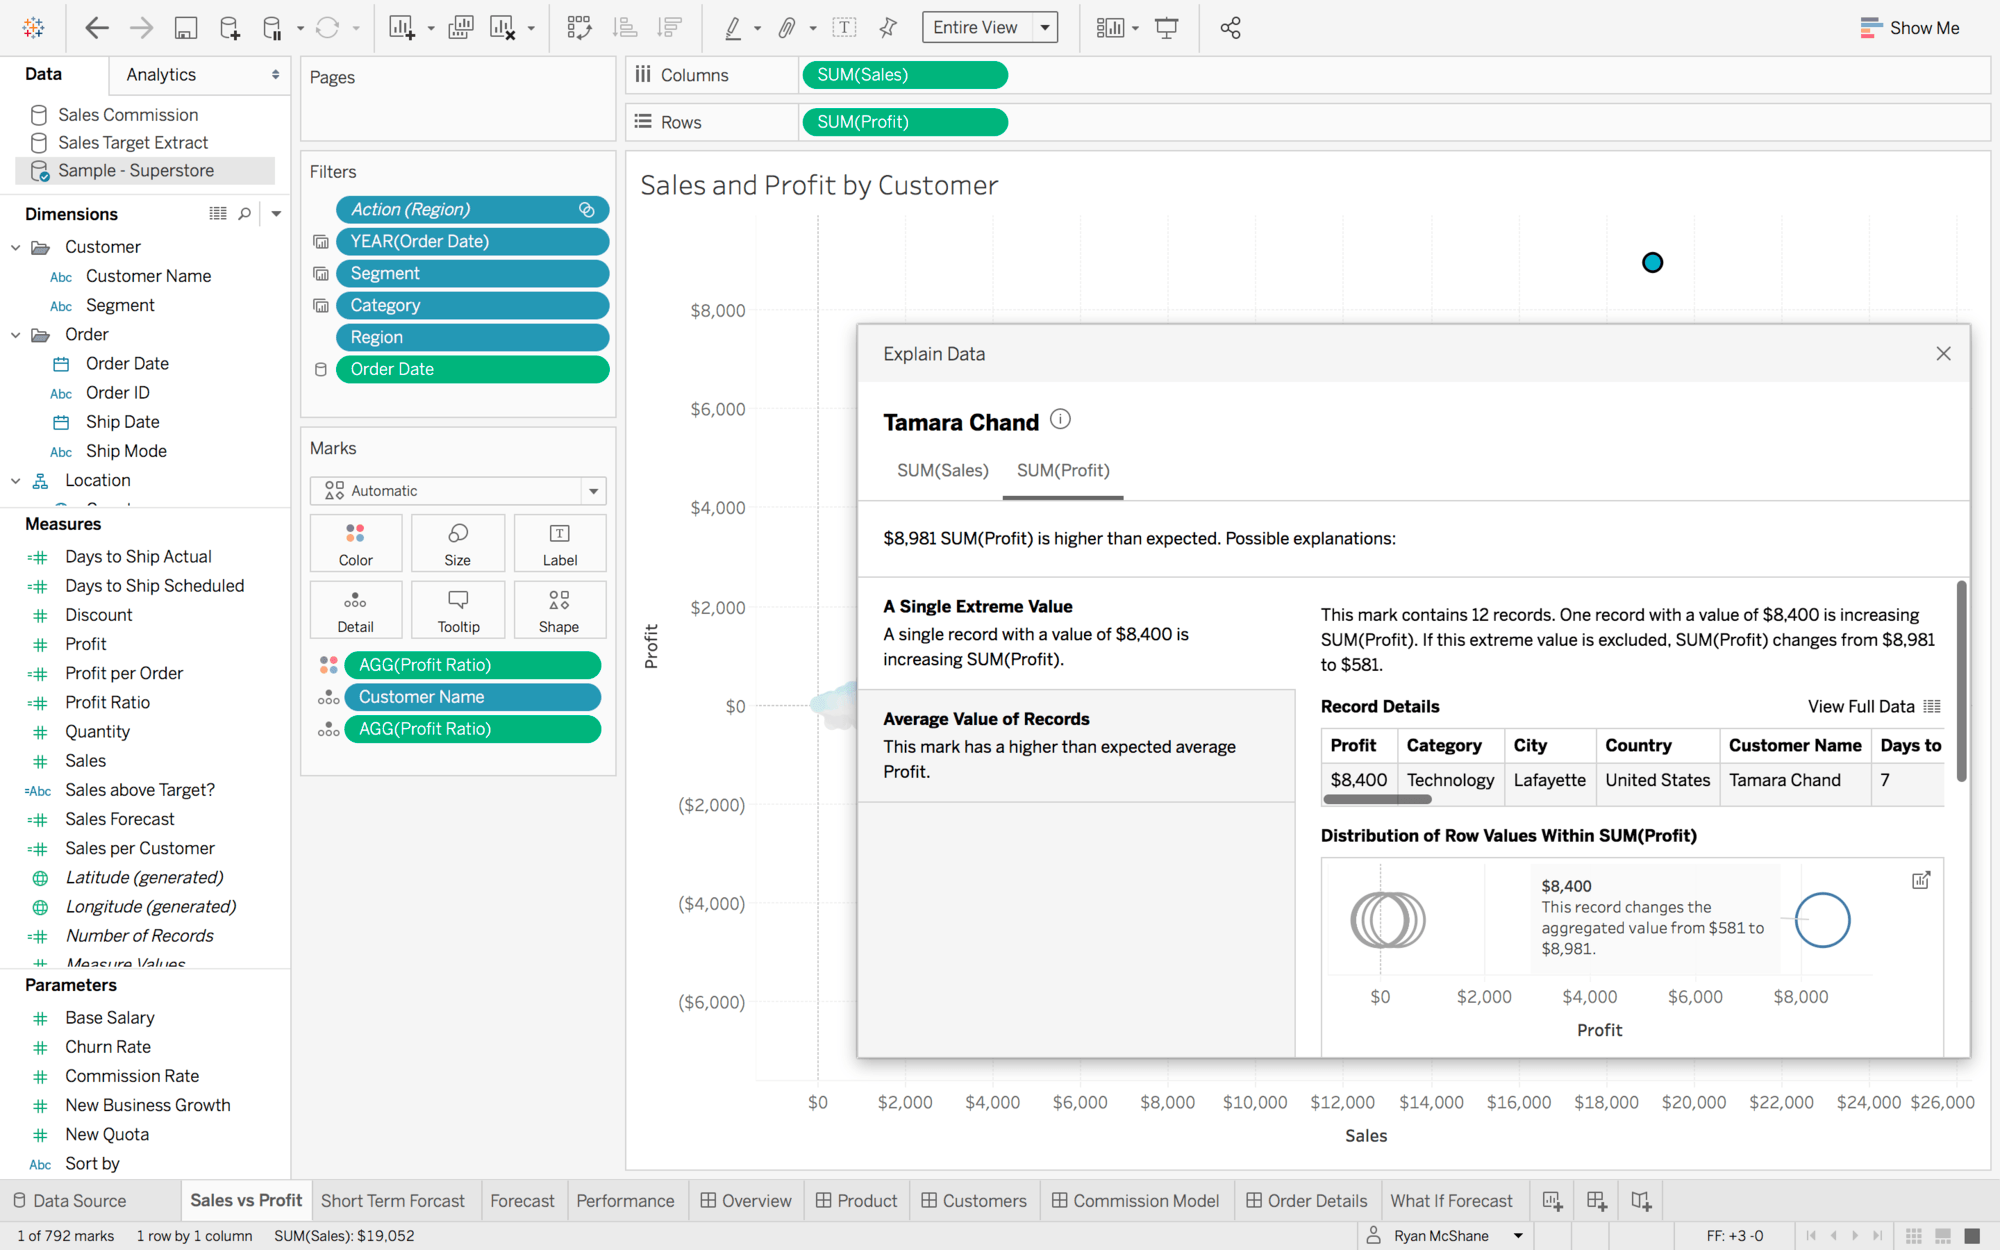
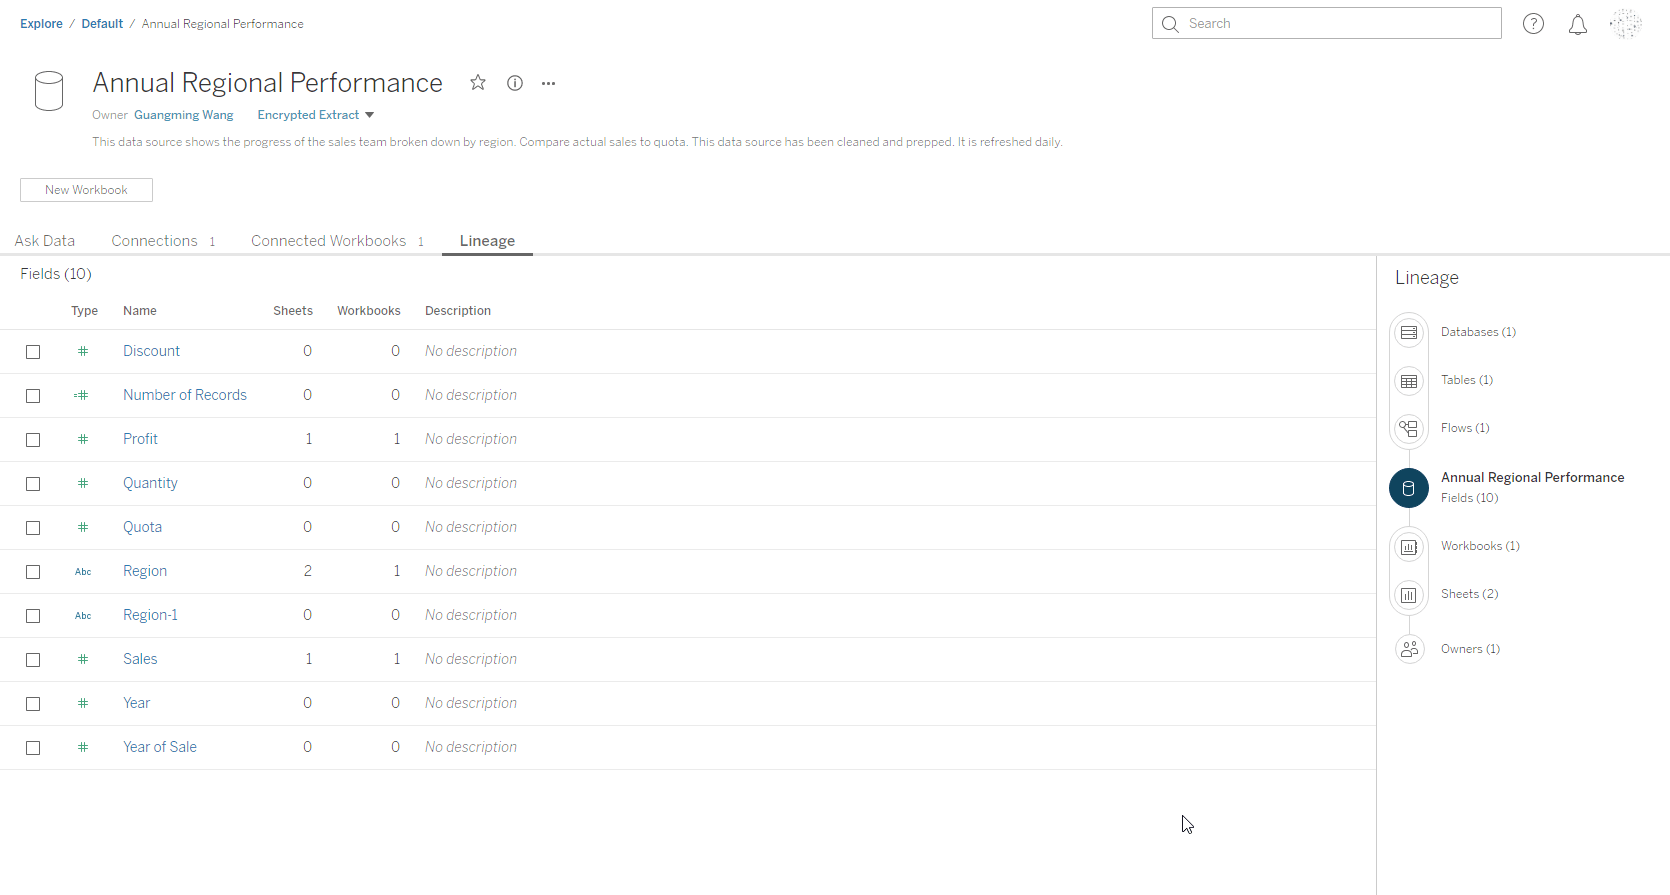
Tableau Catalog
With Tableau Catalog you get a complete view of all of the data being used by Tableau, and how it is connected to your analytics – including lineage, impact analysis and usage metrics. Increase trust and governance in your environment by ensuring that end users know and understand data through the use of data quality indicators and defining rich metadata. Additionally, allow users to discover more relevant data and content by surfacing more relevant search results, putting the data in context with more data details when viewing a dashboard, and surfacing the right data when connecting to and authoring a viz.
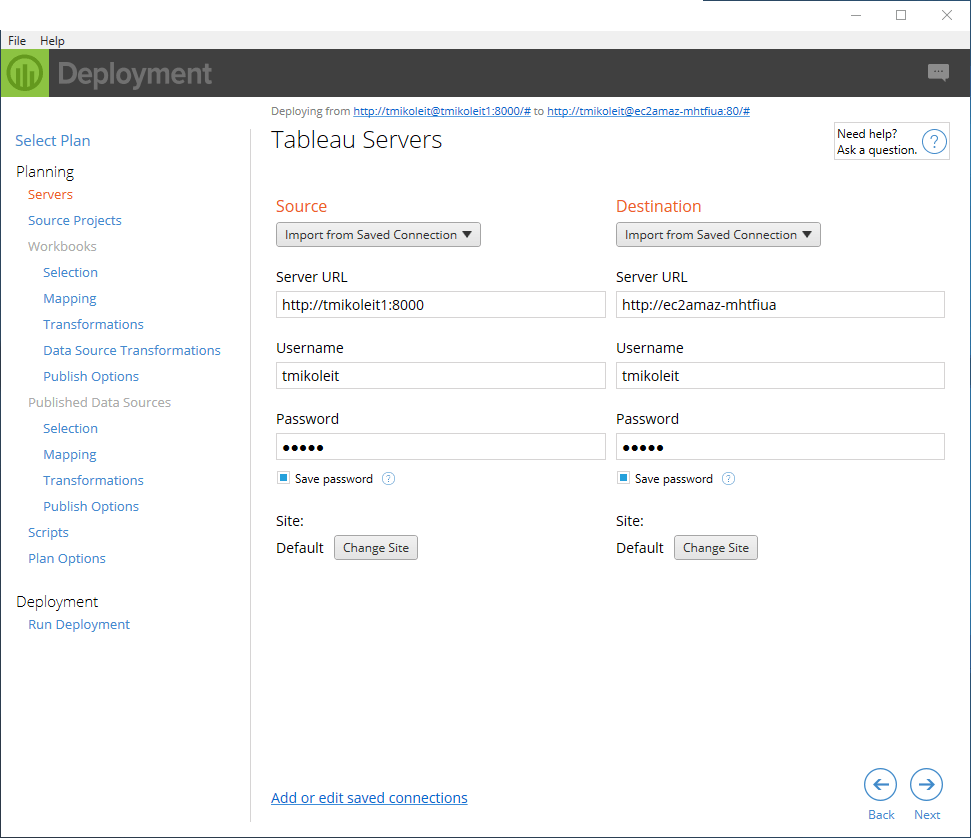
Project McKinley
Project McKinley makes it simpler to run large, mission critical Tableau Server deployments, allowing you to react to the changing needs of your business, and to save time by streamlining the management process. This new offering provides AWS KMS integration, new performance monitoring and content management apps, and additional scalability capabilities for Tableau Server.
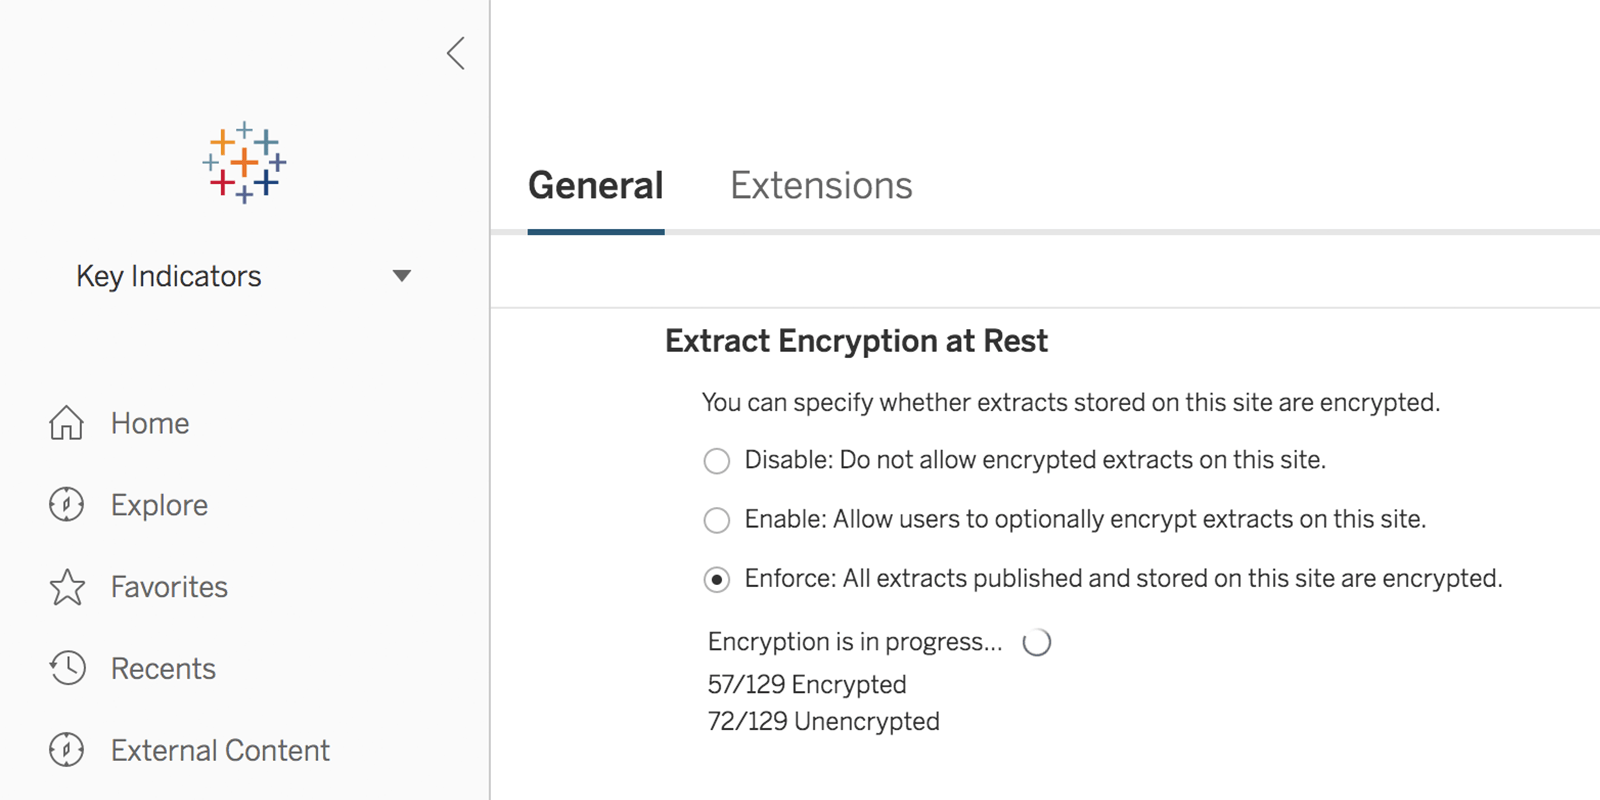
Extract Encryption at Rest for Tableau Server
For additional security you can now encrypt your extracts at rest. You can also think of this as object-level encryption. It’s easy to use—simply toggle it on per extract or enable at the site level. Tableau Online is already fully encrypted at the service level.
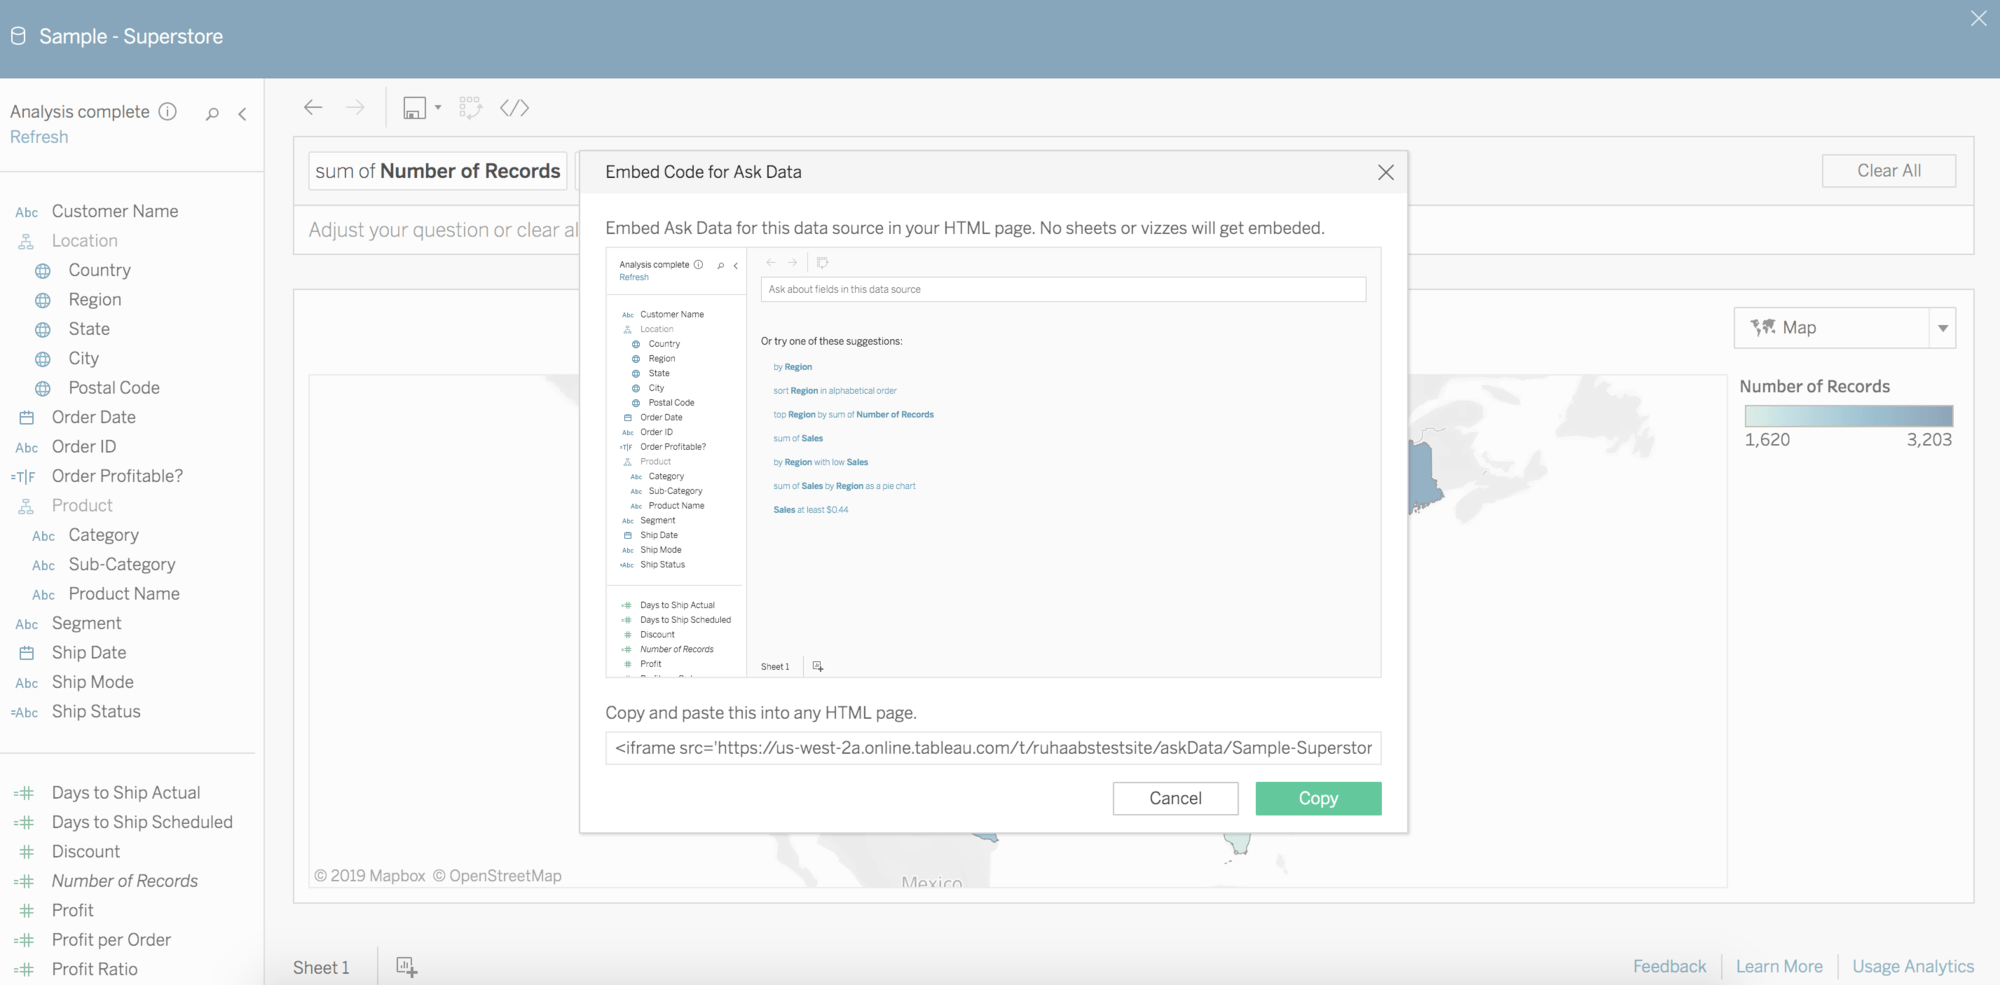
Ask Data Improvements
Embed Ask Data into your company portal or Wiki, and you can enable even more people in your organization to be asking questions of their data.
Web Editing for Tableau Public
Edit and save any of your Tableau Public vizzes directly in your browser. Any changes will be automatically updated in all embedded locations.

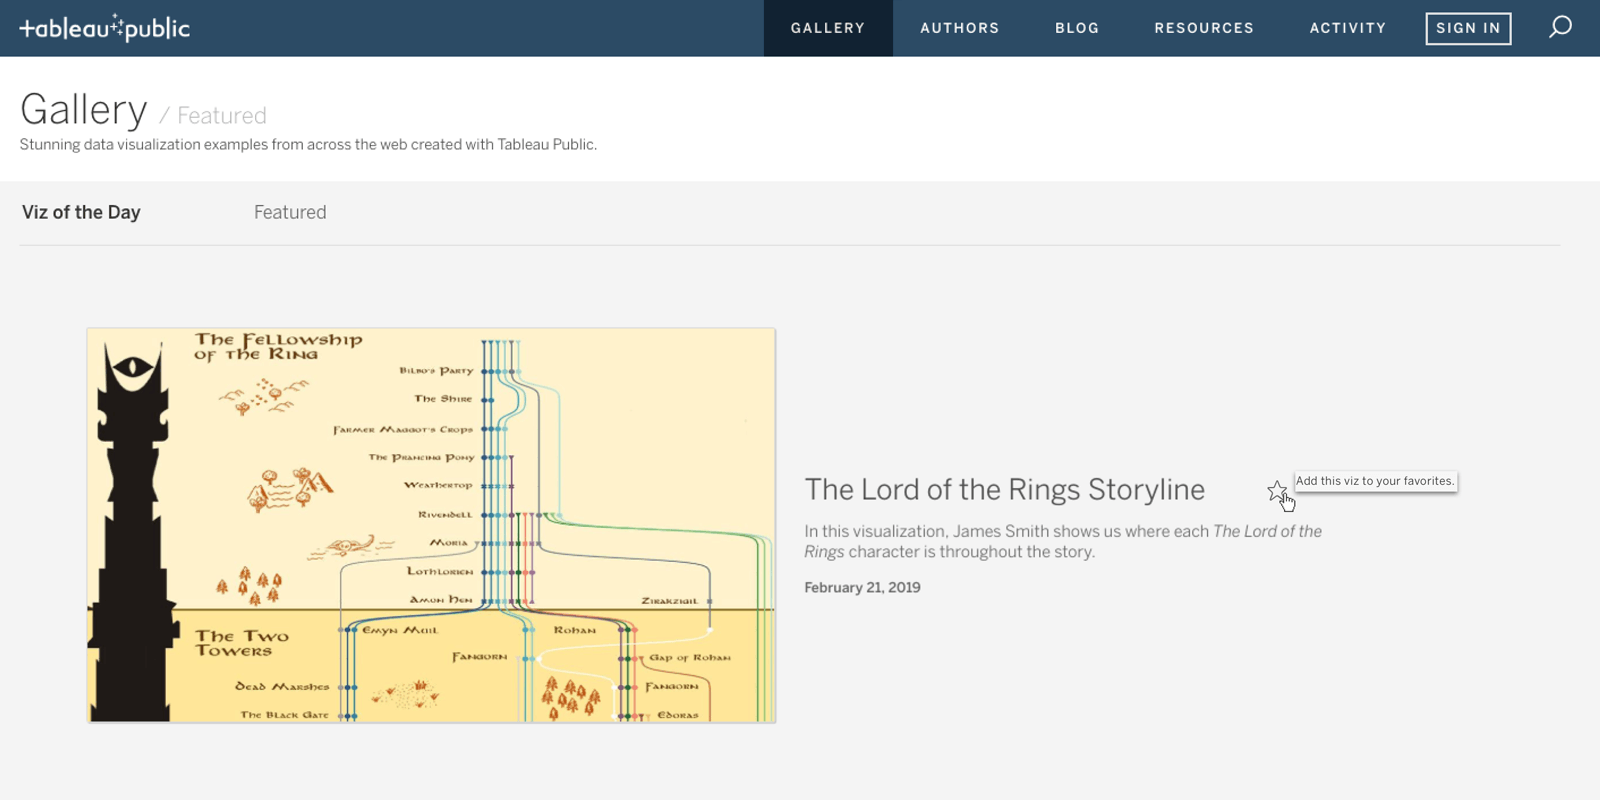
Favorite from the Tableau Public Gallery
You now have the ability to save vizzes from the Tableau Public gallery to your personal collection of favorites, making them easily accessible when searching for inspiration.
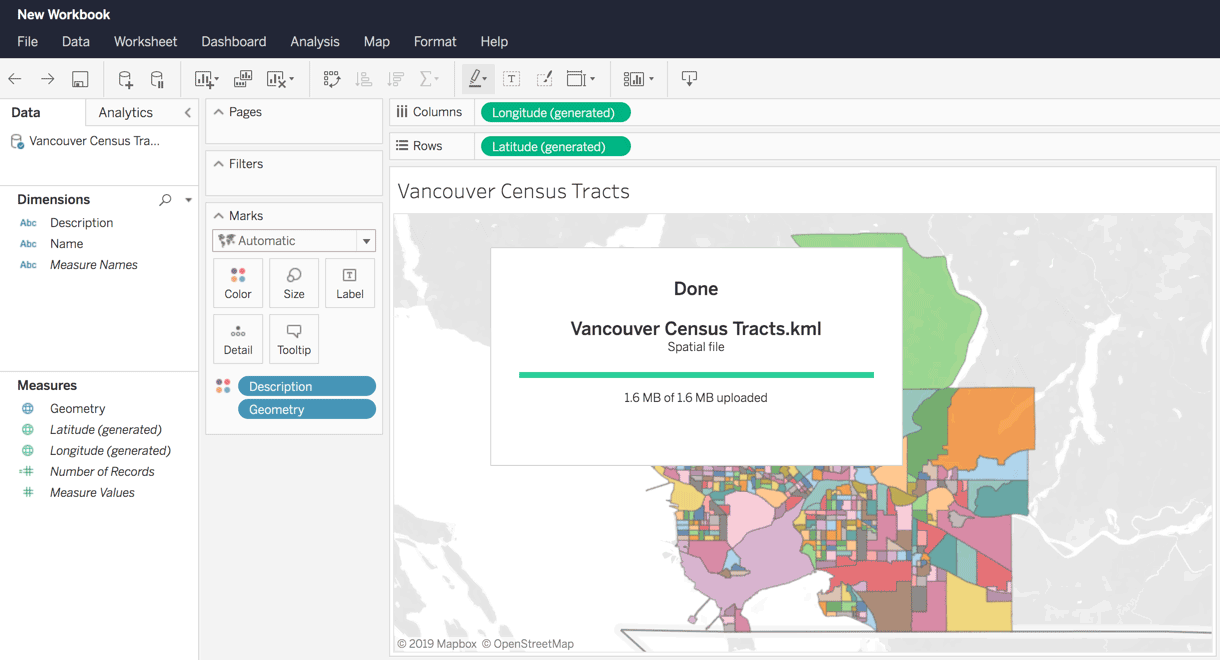
Spatial Files for Web Authoring
Spatial file support has arrived to web authoring. Connect to KML, GeoJSON, and TopoJSON, to better understand and share your location analysis on the web. End to end geospatial analysis, all without leaving the browser.
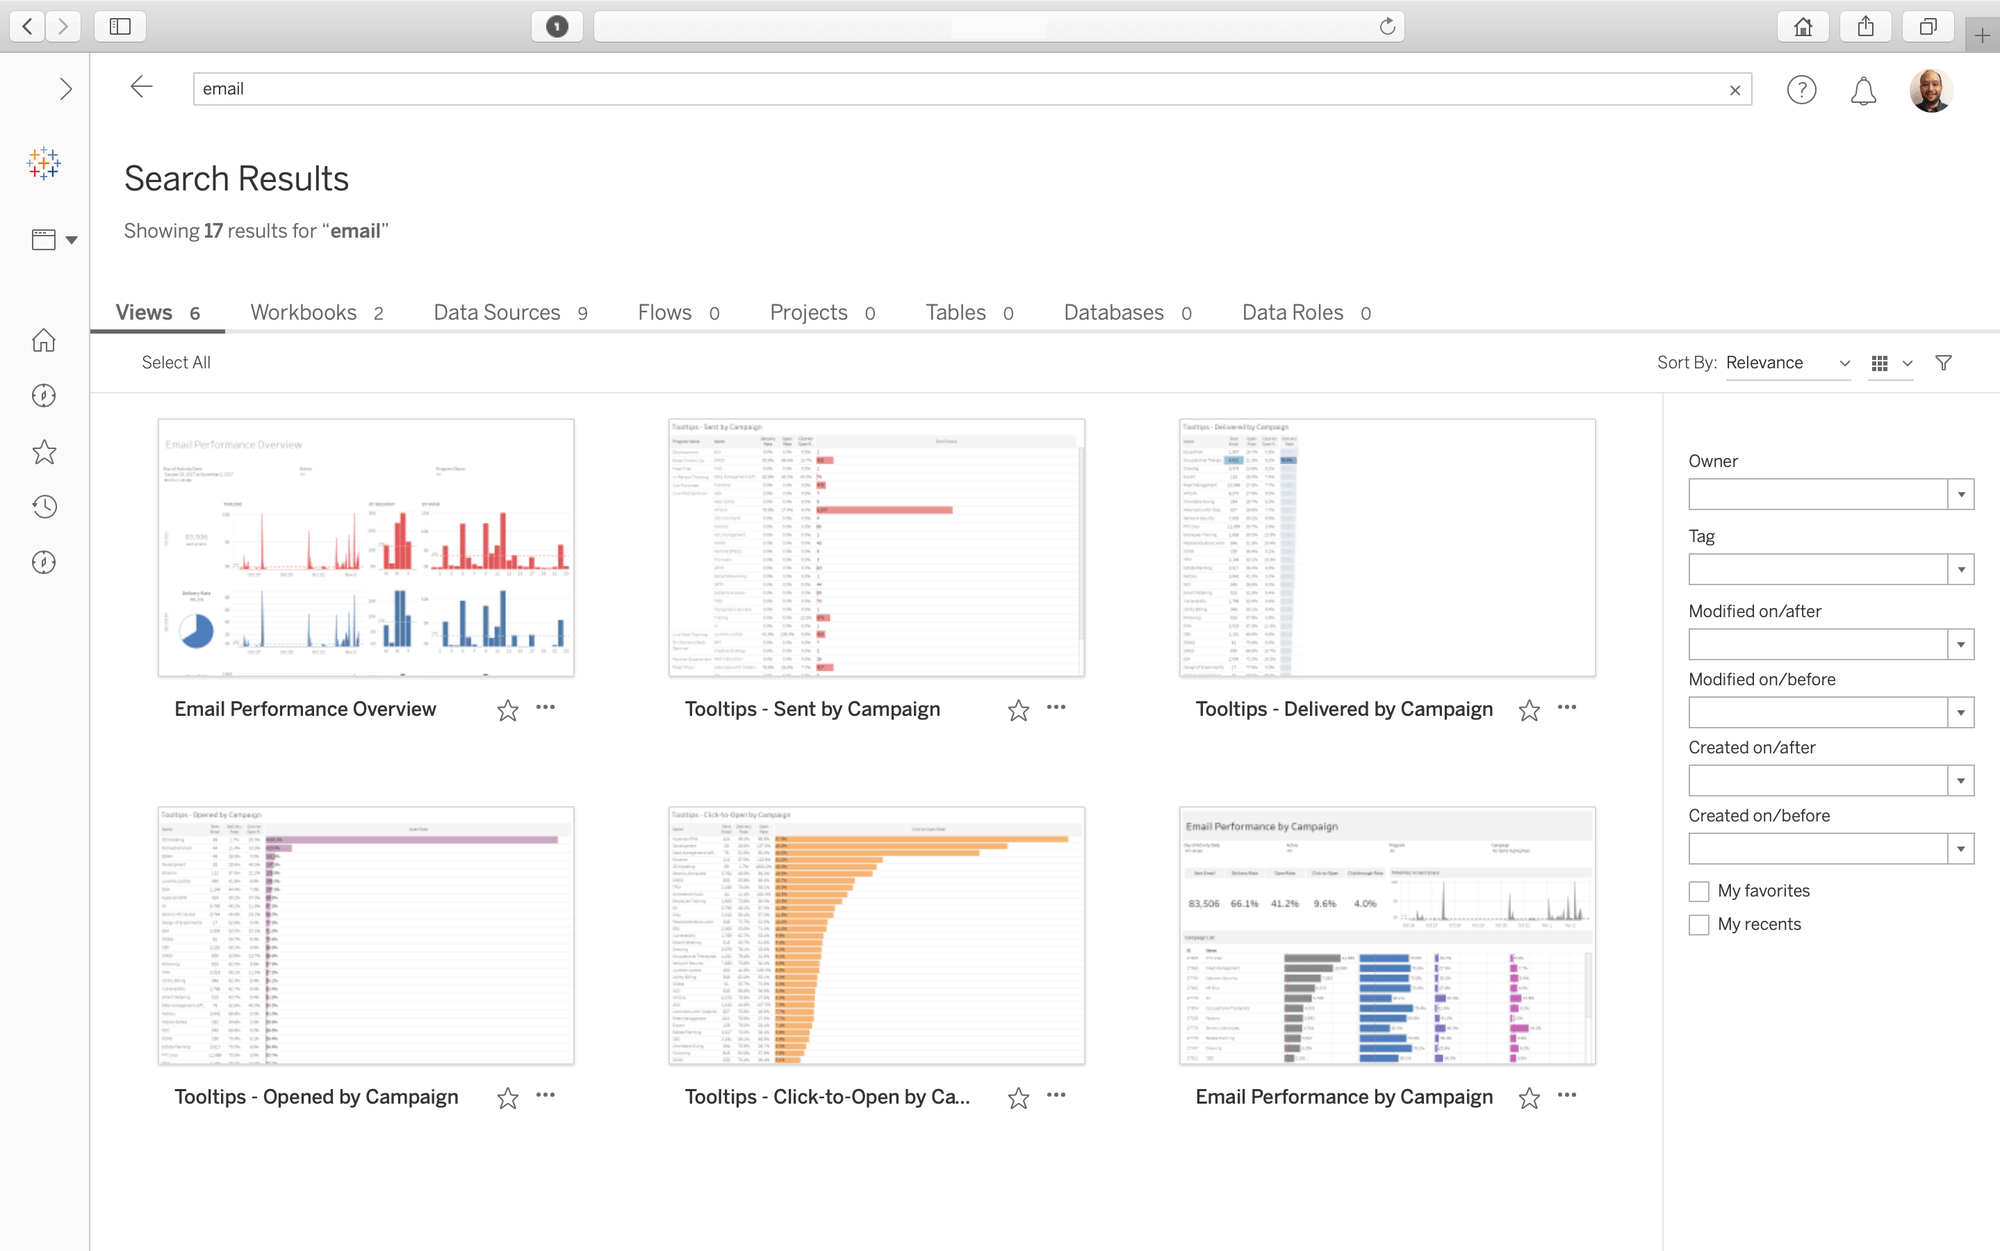
New Search Results Page
Find what you’re looking for faster. Now your search results will be laid out on a newly redesigned search results page. See all your results by views, workbooks, data sources, flows, and other content types.
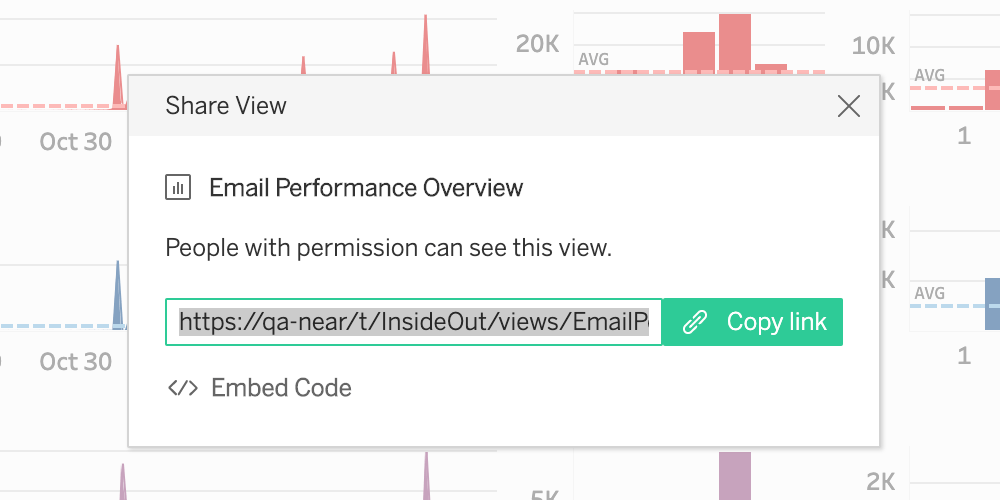
Improved Content Sharing
Share more easily with a simplified share experience. Share projects, workbooks, data sources, views and flows through Tableau Online and Tableau Server.
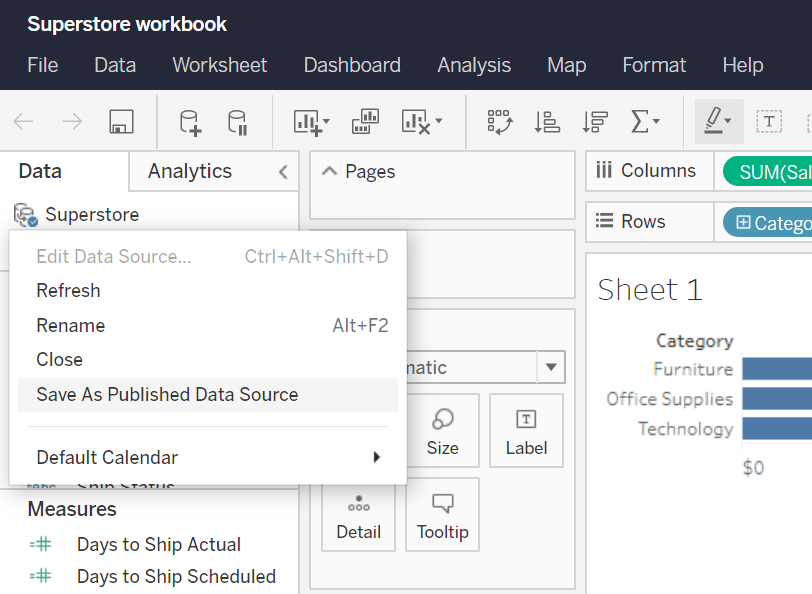
Publish Embedded Data Sources
Quickly and easily publish embedded data sources from workbooks to share with your team.
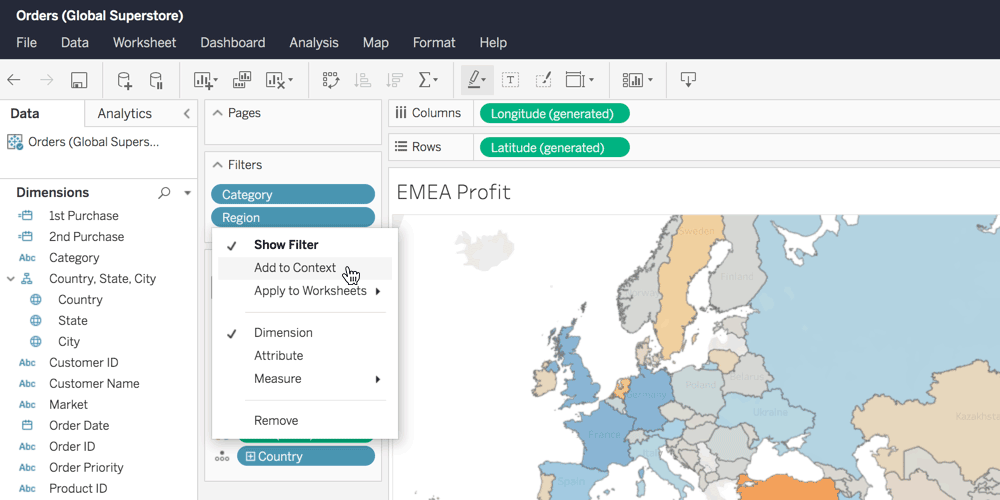
Set Context Filters On The Web
Improvements to web authoring continue with the ability to create context filters and dependent filters in the browser to help drive the performance of your workbook.
Parameter Actions Improvements
Parameter actions just got more powerful with three new aggregation functions: first quartile, third quartile, and concatenation. You also now have the option to create new parameters directly from the parameter action dialog.

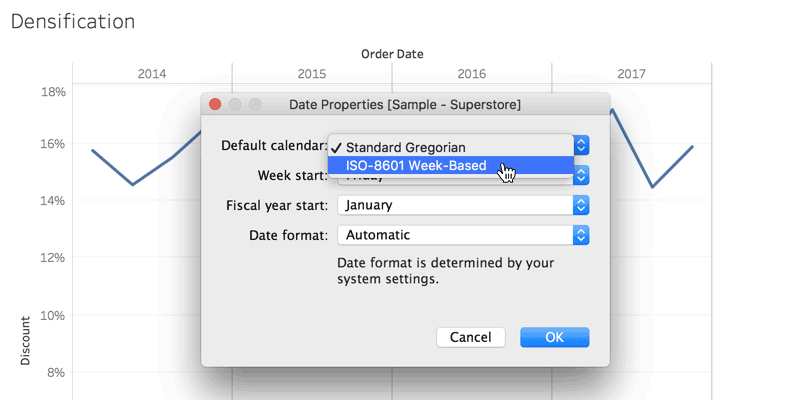
ISO-8601 Calendar Default
You can now set the ISO-8601 calendar so your date parts default to the iso-equivalent of year, quarter, week, and weekday for better calendar-based analysis.
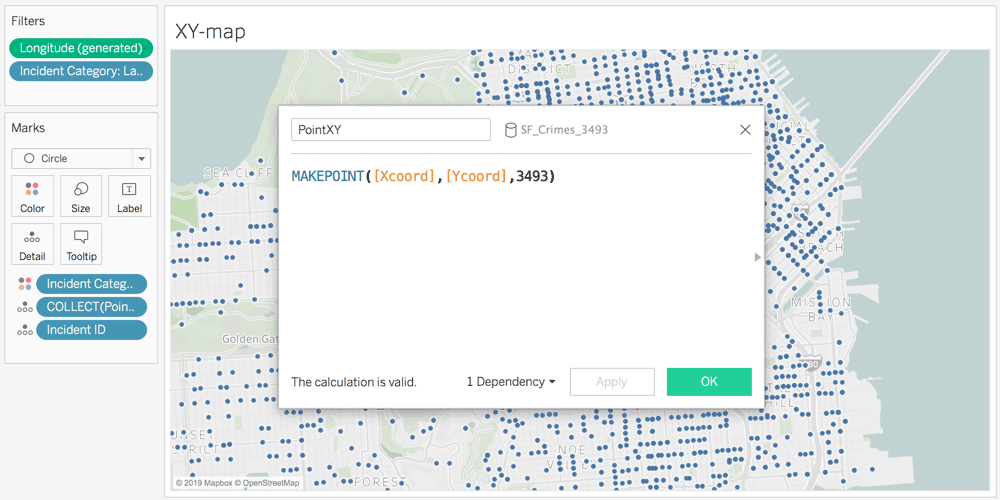
Spatial Calculations: MakePoint Improvements
You can now convert projected coordinates for locations, which might be in feet or meters, into latitudes and longitudes that Tableau can visualize and use in spatial joins. For instance, the Seattle Police Department logs location data using a local projection in US Feet, and can now use MakePoint to convert it directly into usable lat/long coordinates.
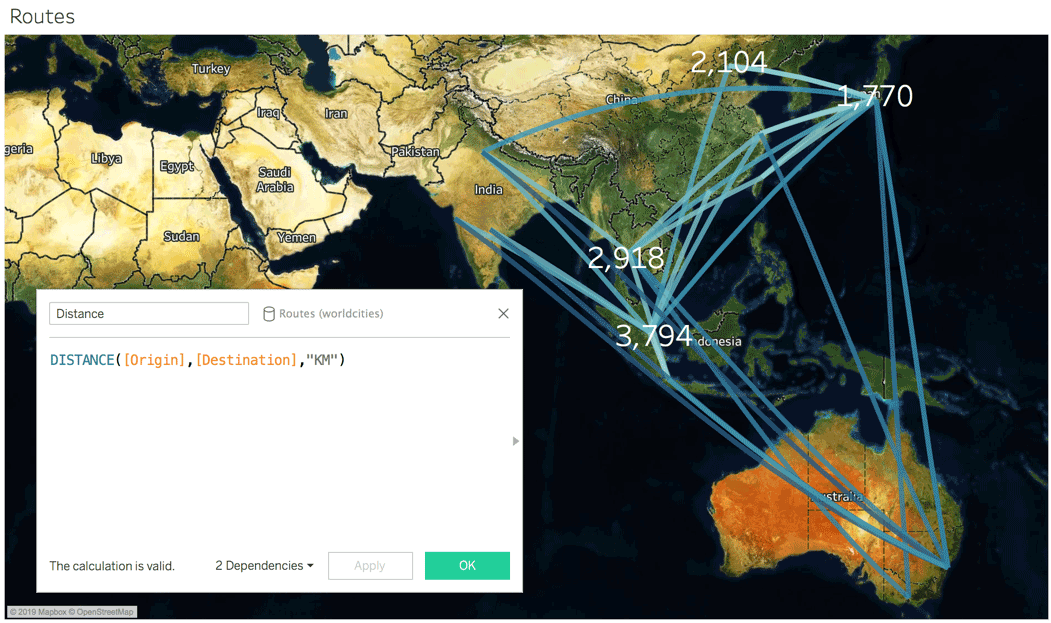
Spatial Calculations: Distance
You can now easily measure the distance between two points, perfect for measuring the length of flight or shipping routes or driving proximity analysis around a store or hub.
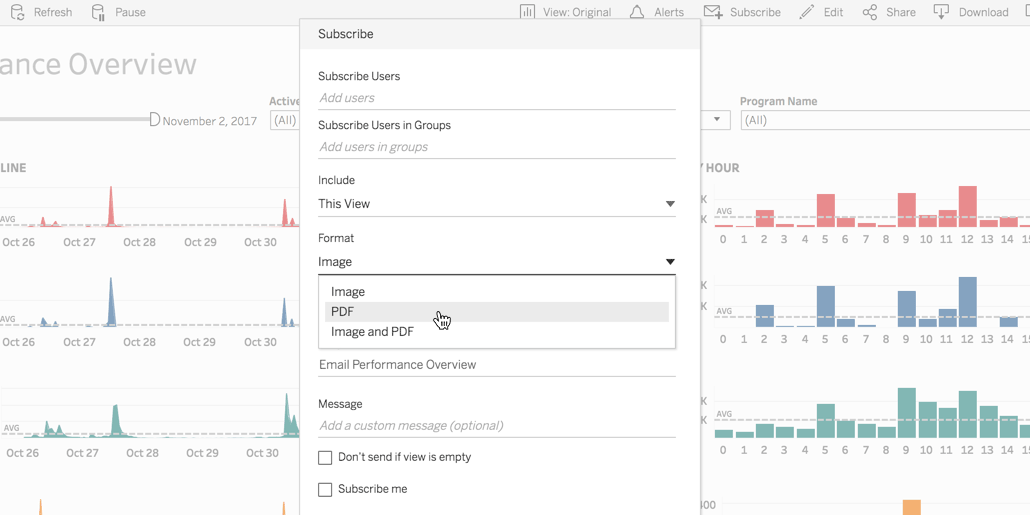
PDF Attachment to Subscriptions
Consolidate your workflows with the option to receive a PDF attachment with your subscription to a dashboard. You can select to attach an image, PDF, or PDF and image, which will land in your inbox as part of your regular subscription email.
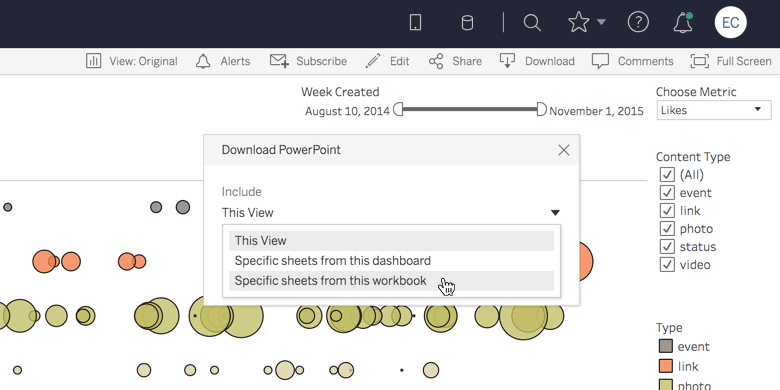
Export to PowerPoint Improvements
Select relevant, specific dashboards to integrate into your presentations. You now have the option to select which sheets, dashboards, or stories to export to PowerPoint.
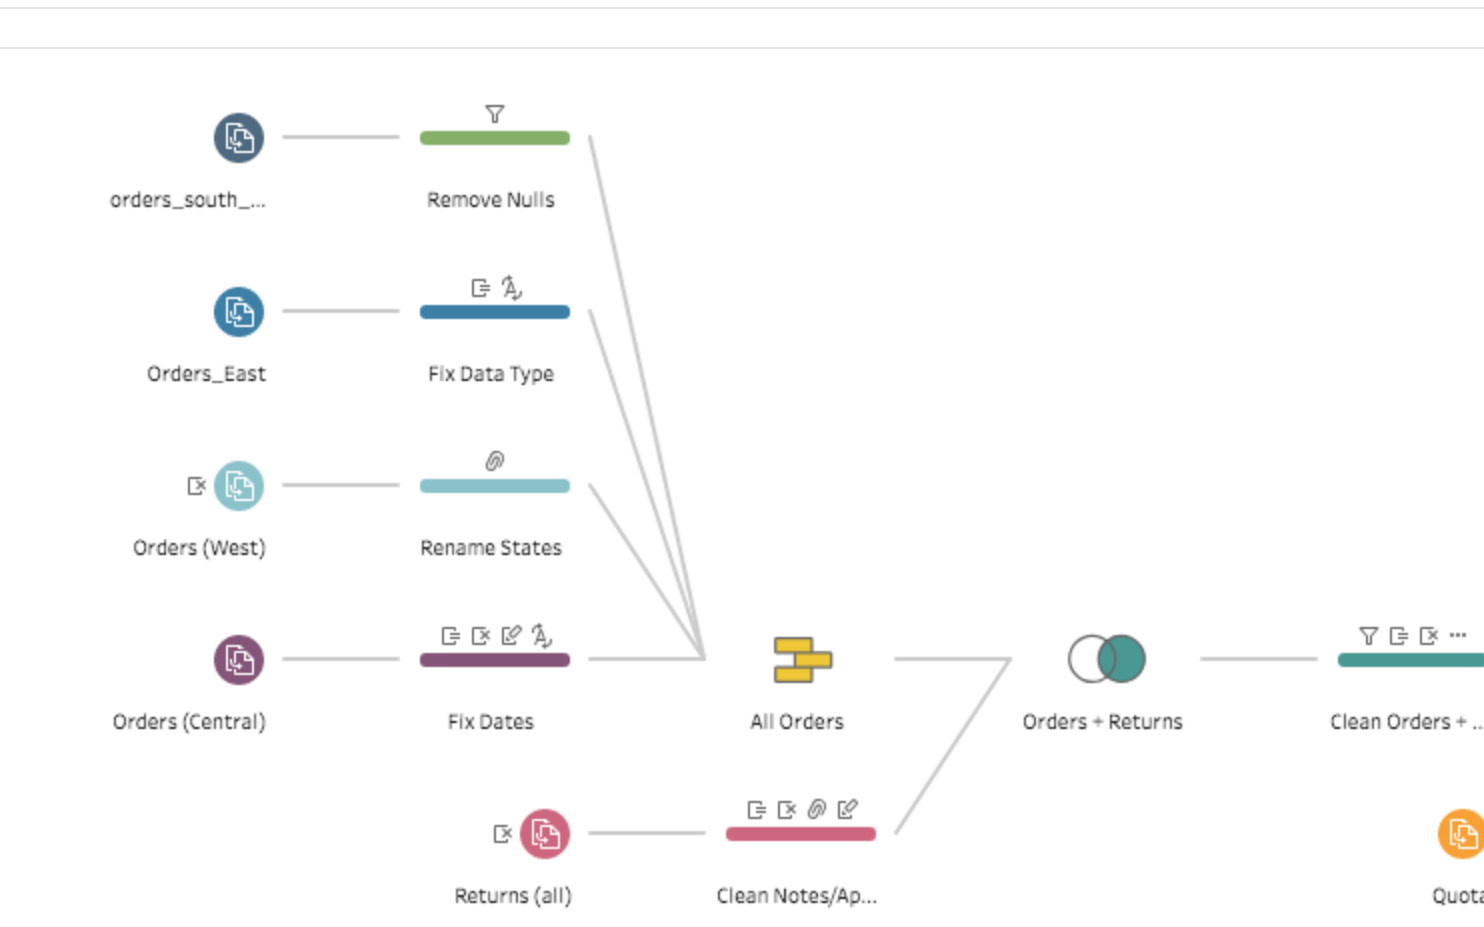
Connect to Published Data Sources With Tableau Prep
Connect to published data sources with Prep Builder and Prep Conductor, so you can build flows with all the data in your Tableau environment.
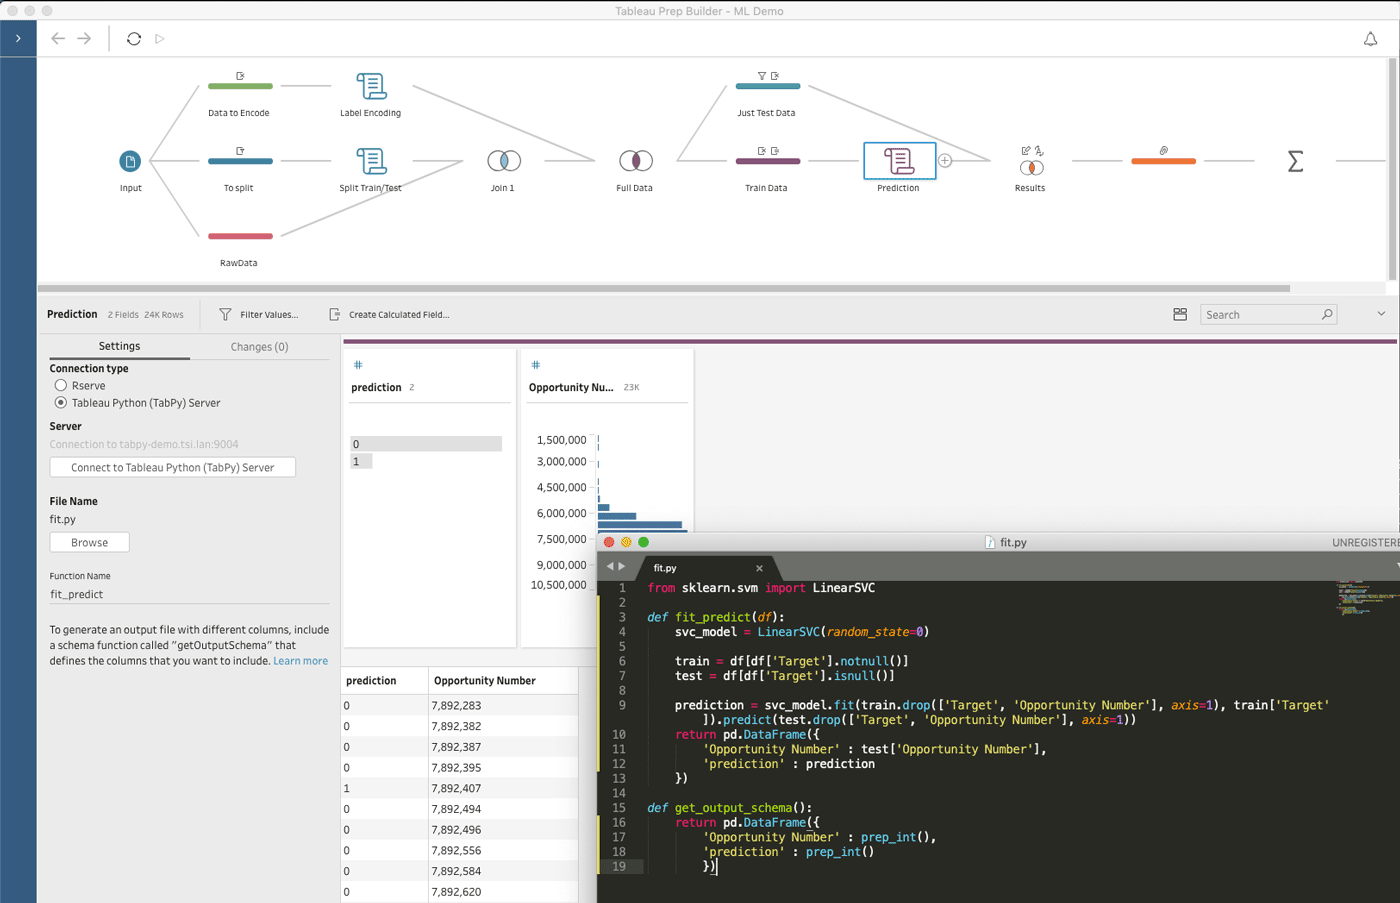
R and Python Integration for Prep Builder
Create a step to run an R or Python script in Tableau Prep Builder, taking advantage of your data science workflows.
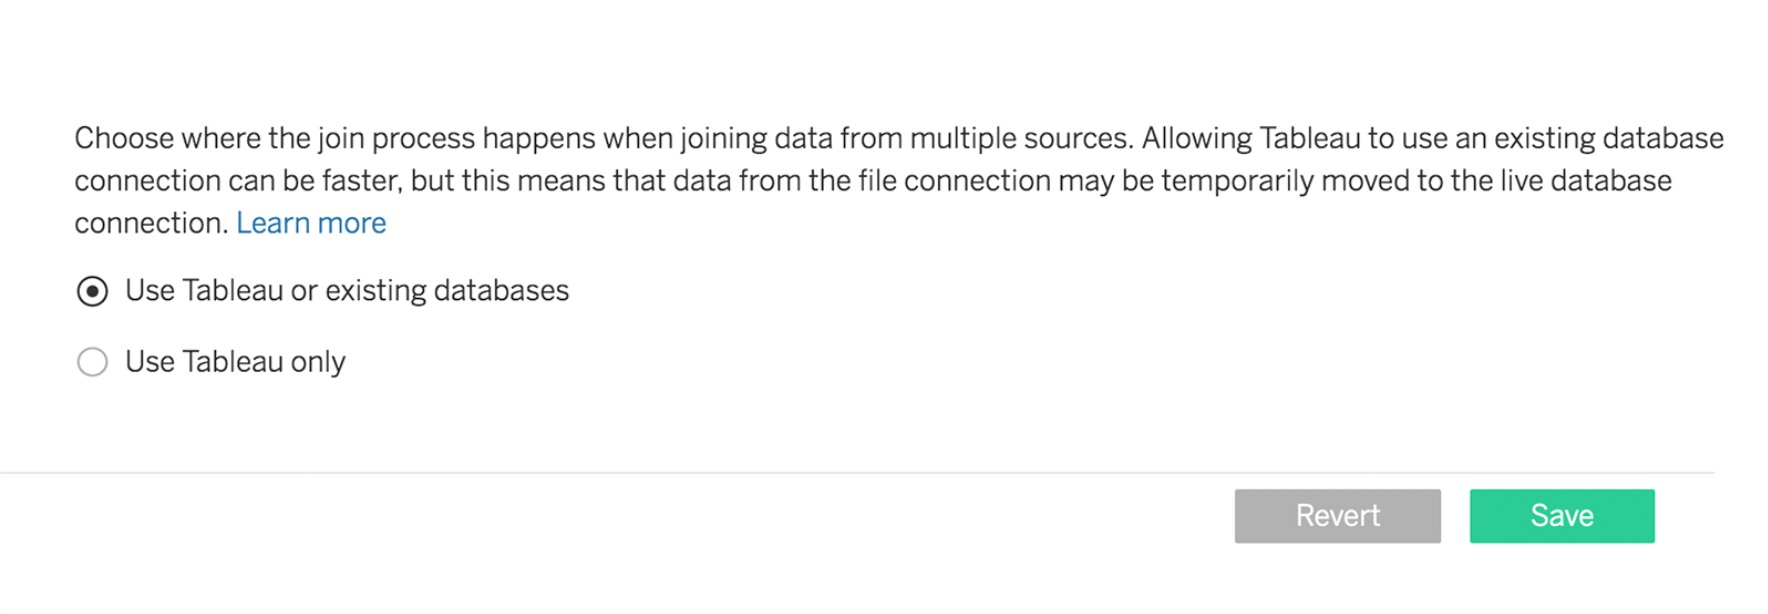
Optimized Joins
Optimize your joins. You can now control if your join is executed in Hyper, or the source database. Control this option from Tableau Desktop or at the site level in Tableau Server or Tableau Online.
DataBricks Connector
For customers using Spark, you can now take full advantage of the innovation of DataBricks as a native connector.
New Product Language: Italian
Italian is now available as a language option, making Tableau feel more familiar for Italian speakers.

Source: Tableau Software, Coming Soon: Tableau 2019.3, https://www.tableau.com/products/coming-soon#feature-110835.
