
Readers:
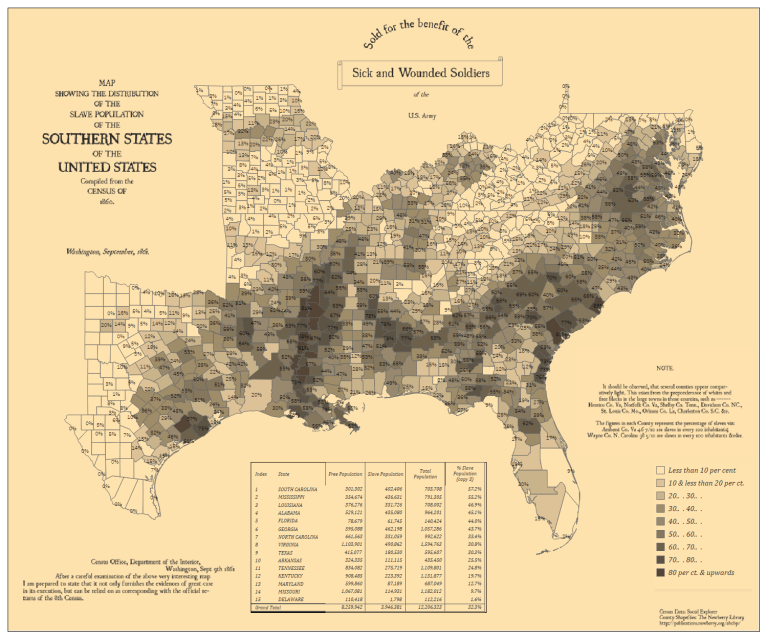
A few weeks ago, I presented at the Tableau Fringe Festival EMEA about how Abraham Lincoln used the 1861 U.S. Coast Survey Map to help him understand slavery in the United States. This map, produced by the US Coast Survey in 1861, drew on census reports from 1860 – the last year that the US government collected census data on slaves. The map shows the prevalence of slavery by county, with darker shaded counties representing a higher percentage of slaves and lighter shaded counties a lower percentage.
It drew on census data and used groundbreaking cartographic techniques (choropleth maps) to visually depict the four million Americans held in bondage in the Southern states. The map revealed which counties had the highest concentrations of slaves, as well as which parts of the Confederacy might be the least committed to the institution.
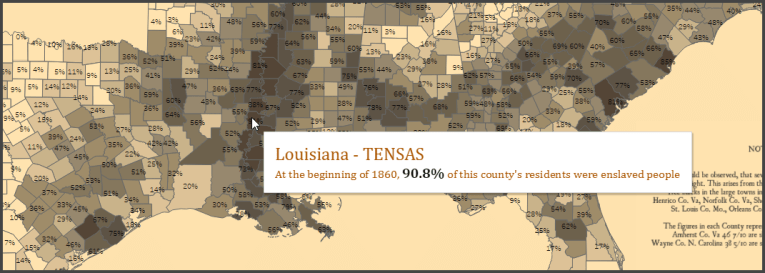
 Yesterday, Spencer Baucke (photo, right) recreated the 1861 Coast Survey Map in Tableau and it was selected as Viz of the Day. Below is a screenshot of Spencer’s map and, if you click on it, it will take you to Tableau Public where you can interact with it.
Congrats to Spencer for being selected as Viz of the Day and for continuing this story along.
Best Regards,
Michael

Michael,Thank you for the subject dataviz example. As always, you bring informative and inspiring examples to us. I frequently forward your message and encourage others to subscribe.As I scrolled over the subject linked visualization, it occurred to me that similar visualizations would be valuable in describing the geography and population distribution associated with governmental representation. Over the course of our nation’s history, some areas have developed disproportionately relative to the formulae for representation in the Senate and House. Seeing, at a glance, the ratio of voters to government votes (Senators and Congresspersons) would be informative, as would a depiction of numbers of residents to representation. Perhaps someone in your Tableau community has addressed this and you could bring it forward.Thanks again.dhDavid A. HelgersonPresident & Senior Naval ArchitectDavid Helgerson & Associates, LLCwww.dhelgerson.comdh@dhelgerson.com571-239-9435 Please support the Teaching With Small Boats Alliance,and your local educational boatbuilding organizations, such asThe Alexandria Seaport Foundation.(I have not included the links since some email systems object to embedded hyperlinks; a simple search will find the TWSBA site, which will point to many educational boatbuilding organizations.) Thanks.