Readers:
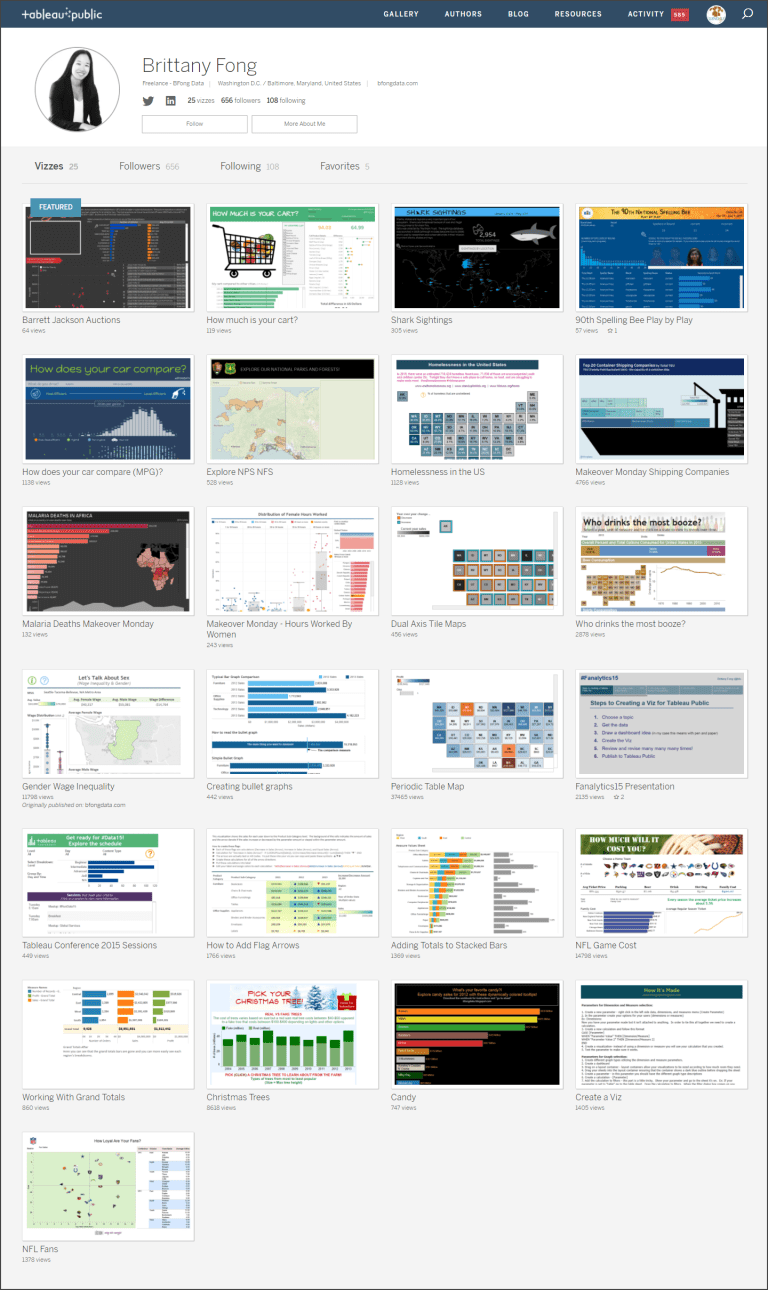
 Today, I am featuring an interview with Brittany Fong.
Brittany is a leading voice in the data visualization community and has been a Tableau power user since 2012. She is the organizer of the DC Tableau User Group, a co-organizer of the DC Data + Women group, and a Tableau User Group Ambassador (designation given by Tableau).
Brittany has taught numerous Tableau and data visualization best practice courses and workshops at universities and organizations in the United States. Brittany is located in Severn, MD. She enjoys developing creative, informative and functional visualizations to overcome business challenges.
An Interview With Brittany Fong
Michael: Hi Brittany, it is very nice to finally meet you. If you don’t mind I am going to dive right into the questions.
Michael: You organized and founded the Washington DC Tableau User Group. Can you tell us a bit about what kinds of topics you discuss at your meetings, how often you meet, and how people can contact you to attend your meetings?
Brittany: The DC user group up till this year has been pretty standard. About 100-120 of us meet about every other month on a weekday afternoon (during work hours). Generally we have 3 to 4 presentations with questions. The presentations range from user stories, implementing Tableau, use case examples, Tableau tips and tricks, and more. This year, I’m going to start trying some non-traditional meetings to see how it goes!
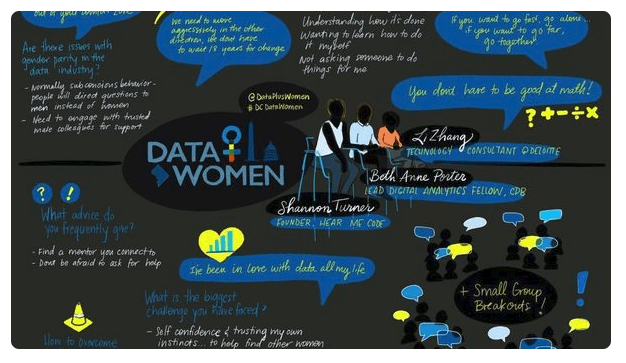
Michael: You are also one of the co-organizers of the DC Data + Women group. Can you tell us a little bit about the group and what kinds of services you offer women who work with data?
Brittany: This has been a really great group (Emily Kund, Erin Simpler-Kellett, and Julie Kim) to work with! Our data + women group really focuses on soft skills. How to market yourself, how to set goals, and how to achieve your goals. We have had a few meetings where we focused on technical skills with some lightning talks. Recently, we’ve partnered up with the DC She Talks Data group (Alexis Smith).
Additionally, we have had a workshop for high school aged girls to come and learn about data analytics and data visualization. We received really great feedback on this workshop, and we’re planning on conducting it again a few times this year.
Michael: O.K., I am going to put you on the spot here. Tell us three of your favorite Tableau tips that you consider priceless.
Brittany:
Copying formatting! This is a HUGE time saver. Formatting takes so many clicks, and being able to setup the formatting on one sheet and pasting it over is really helpful!
Custom color palettes! Especially when you’re working with companies who want their dashboards to be brand compliant, the custom palettes make life so much easier. I don’t have to memorize HEX codes and then type them in every time.
Parameters! I couldn’t use Tableau if it weren’t for parameters. They can do so much, and add so much flexibility to your dashboards. No more making the same dashboard over and over again, just so you can get a different dimension or measure.
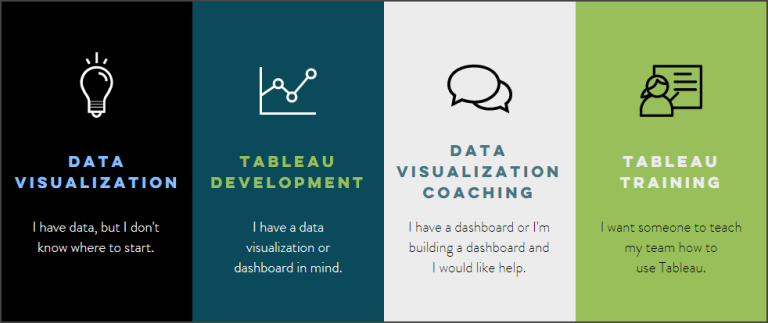
Michael: You recently ventured out on your own with BFONGDATA. Can you tell us a little bit about your company, the services you offer, etc.?
Brittany: I’ve been freelancing part-time for a while now and I decided at the end of 2016 that it was time to make the jump and go full-time. As a full time data visualization and UX designer, I really want to create dashboards that are creative and functional. The fun part about my work is listening to the business needs that are voiced and silent, then develop something that is work-changing. Data that the business never used to be able to see is at the tip of anyone’s finger tips. It’s really fun to see the enthusiasm of clients when they can see and use their data to make relevant decisions.
Michael: As a coach, how do you approach helping a person brand new to Tableau?
Brittany: I wrote a whole blog post on this, “I don’t know what to do, I’m new!”, since I was getting this question from so many people. I really stress that you need to work with fun data (not work data, or data you’re really familiar with). When you already know the data you have a preconceived idea of how it should be displayed. Once you have data, watch the tutorial videos on Tableau’s website to learn the basics of the tool. Lastly, jot down/sketch out some graph ideas and try to make them. Don’t be afraid to mess up or click something wrong, just click around and learn the tool naturally.
Michael: Thank you, Brittany. I really appreciate your insights and look forward to seeing you again at the Tableau Customer Conference 2018 in New Orleans.